
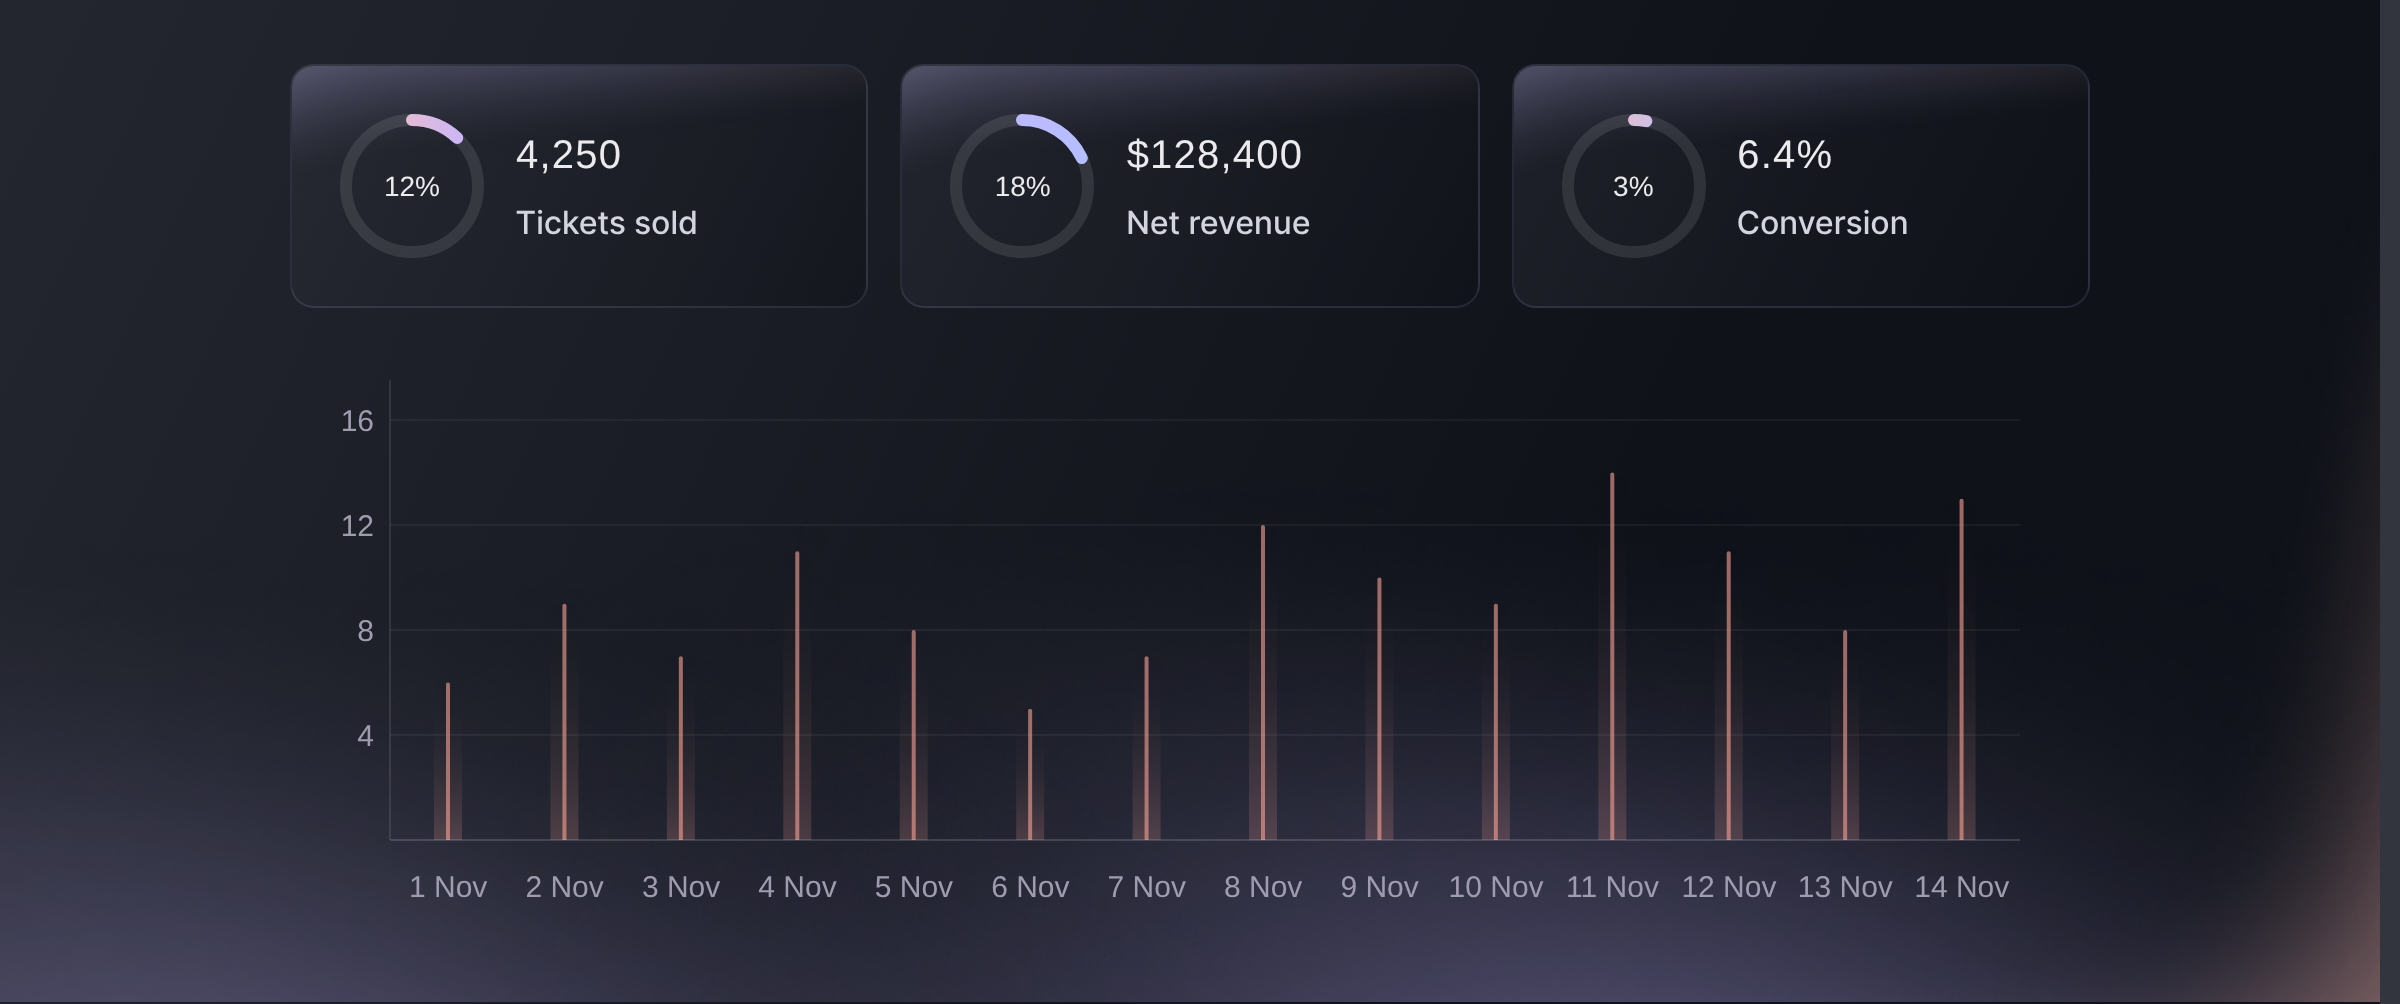
See How Your On-Sale Is Going While It Happens
The figures across the top of your Performance page show the tickets sold and the net revenue, with the tickets sitting in buyers' carts underneath. They refresh while you watch, so you can follow an on-sale from your desk. Ticket Sales gives one row per day with running totals and a chart by day or by week, and Sales by Type shows what each ticket type has sold and earned, so you can decide which release to open next.
- Performance figures: tickets sold, net revenue and tickets in carts
- Ticket Sales: sales by day or by week, with running totals
- Sales by Type: what each ticket type has sold and earned

We’ll be right with you!
Thank you for your patience
We are using a virtual queue to limit the amount of users on the website at the moment.
This will ensure you have the best possible online experience.
If this page is taking longer to load than expected, or tried multiple times and it is still not loading, please contact support at [email protected].
This page will automatically refresh, please do not close your browser.
Last updated