1. Features
  2. Sales reports
  3. Live sales & reports

Know How Your Tickets Are Selling at Every Moment

In the first hours of an on-sale you need to know how many tickets have gone, what the event has earned and which release to open next. Your event's Performance page shows all three while you watch, sets this year against last year at the same point, and opens a report for every part of your sales. Afterwards, replay the on-sale minute by minute, share live figures with your venue and partners, and take the exact orders behind any number into a spreadsheet.

  • Tickets sold and revenue while the on-sale runs
  • This event set against your last one
  • Live sales shared with the partners who need them
Ticket Fairy Ticket Sales tab of the Performance page, with the sales curve above a table of one row per day and its running totals

Watch Tickets Sold and Revenue Climb During Your On-Sale

Keep your Performance page open when the tickets go on sale, and the figures across the top climb as buyers pay. Tickets shows how many have sold, with the tickets sitting in buyers' carts underneath, and Net revenue shows what the event has earned, with the figure before referral rebates under it. You see the rush as it happens and can tell your team how the on-sale is going without waiting for a report.

The tickets in carts tell you about demand that has not turned into sales yet. A large number in carts and a slow climb in tickets sold during a big drop is the moment to check your checkout. The Tickets in Cart tab lists those carts, with where the buyers are.

  • Tickets: tickets sold, with the tickets in buyers' carts
  • Net revenue: what the event has earned, with referral rebates shown
  • Refreshes while you watch: keep the page open and the figures stay current
Ticket Fairy figures across the top of the Performance page, with tickets sold, net revenue and the referral rebates owed

Decide Which Release to Open Next

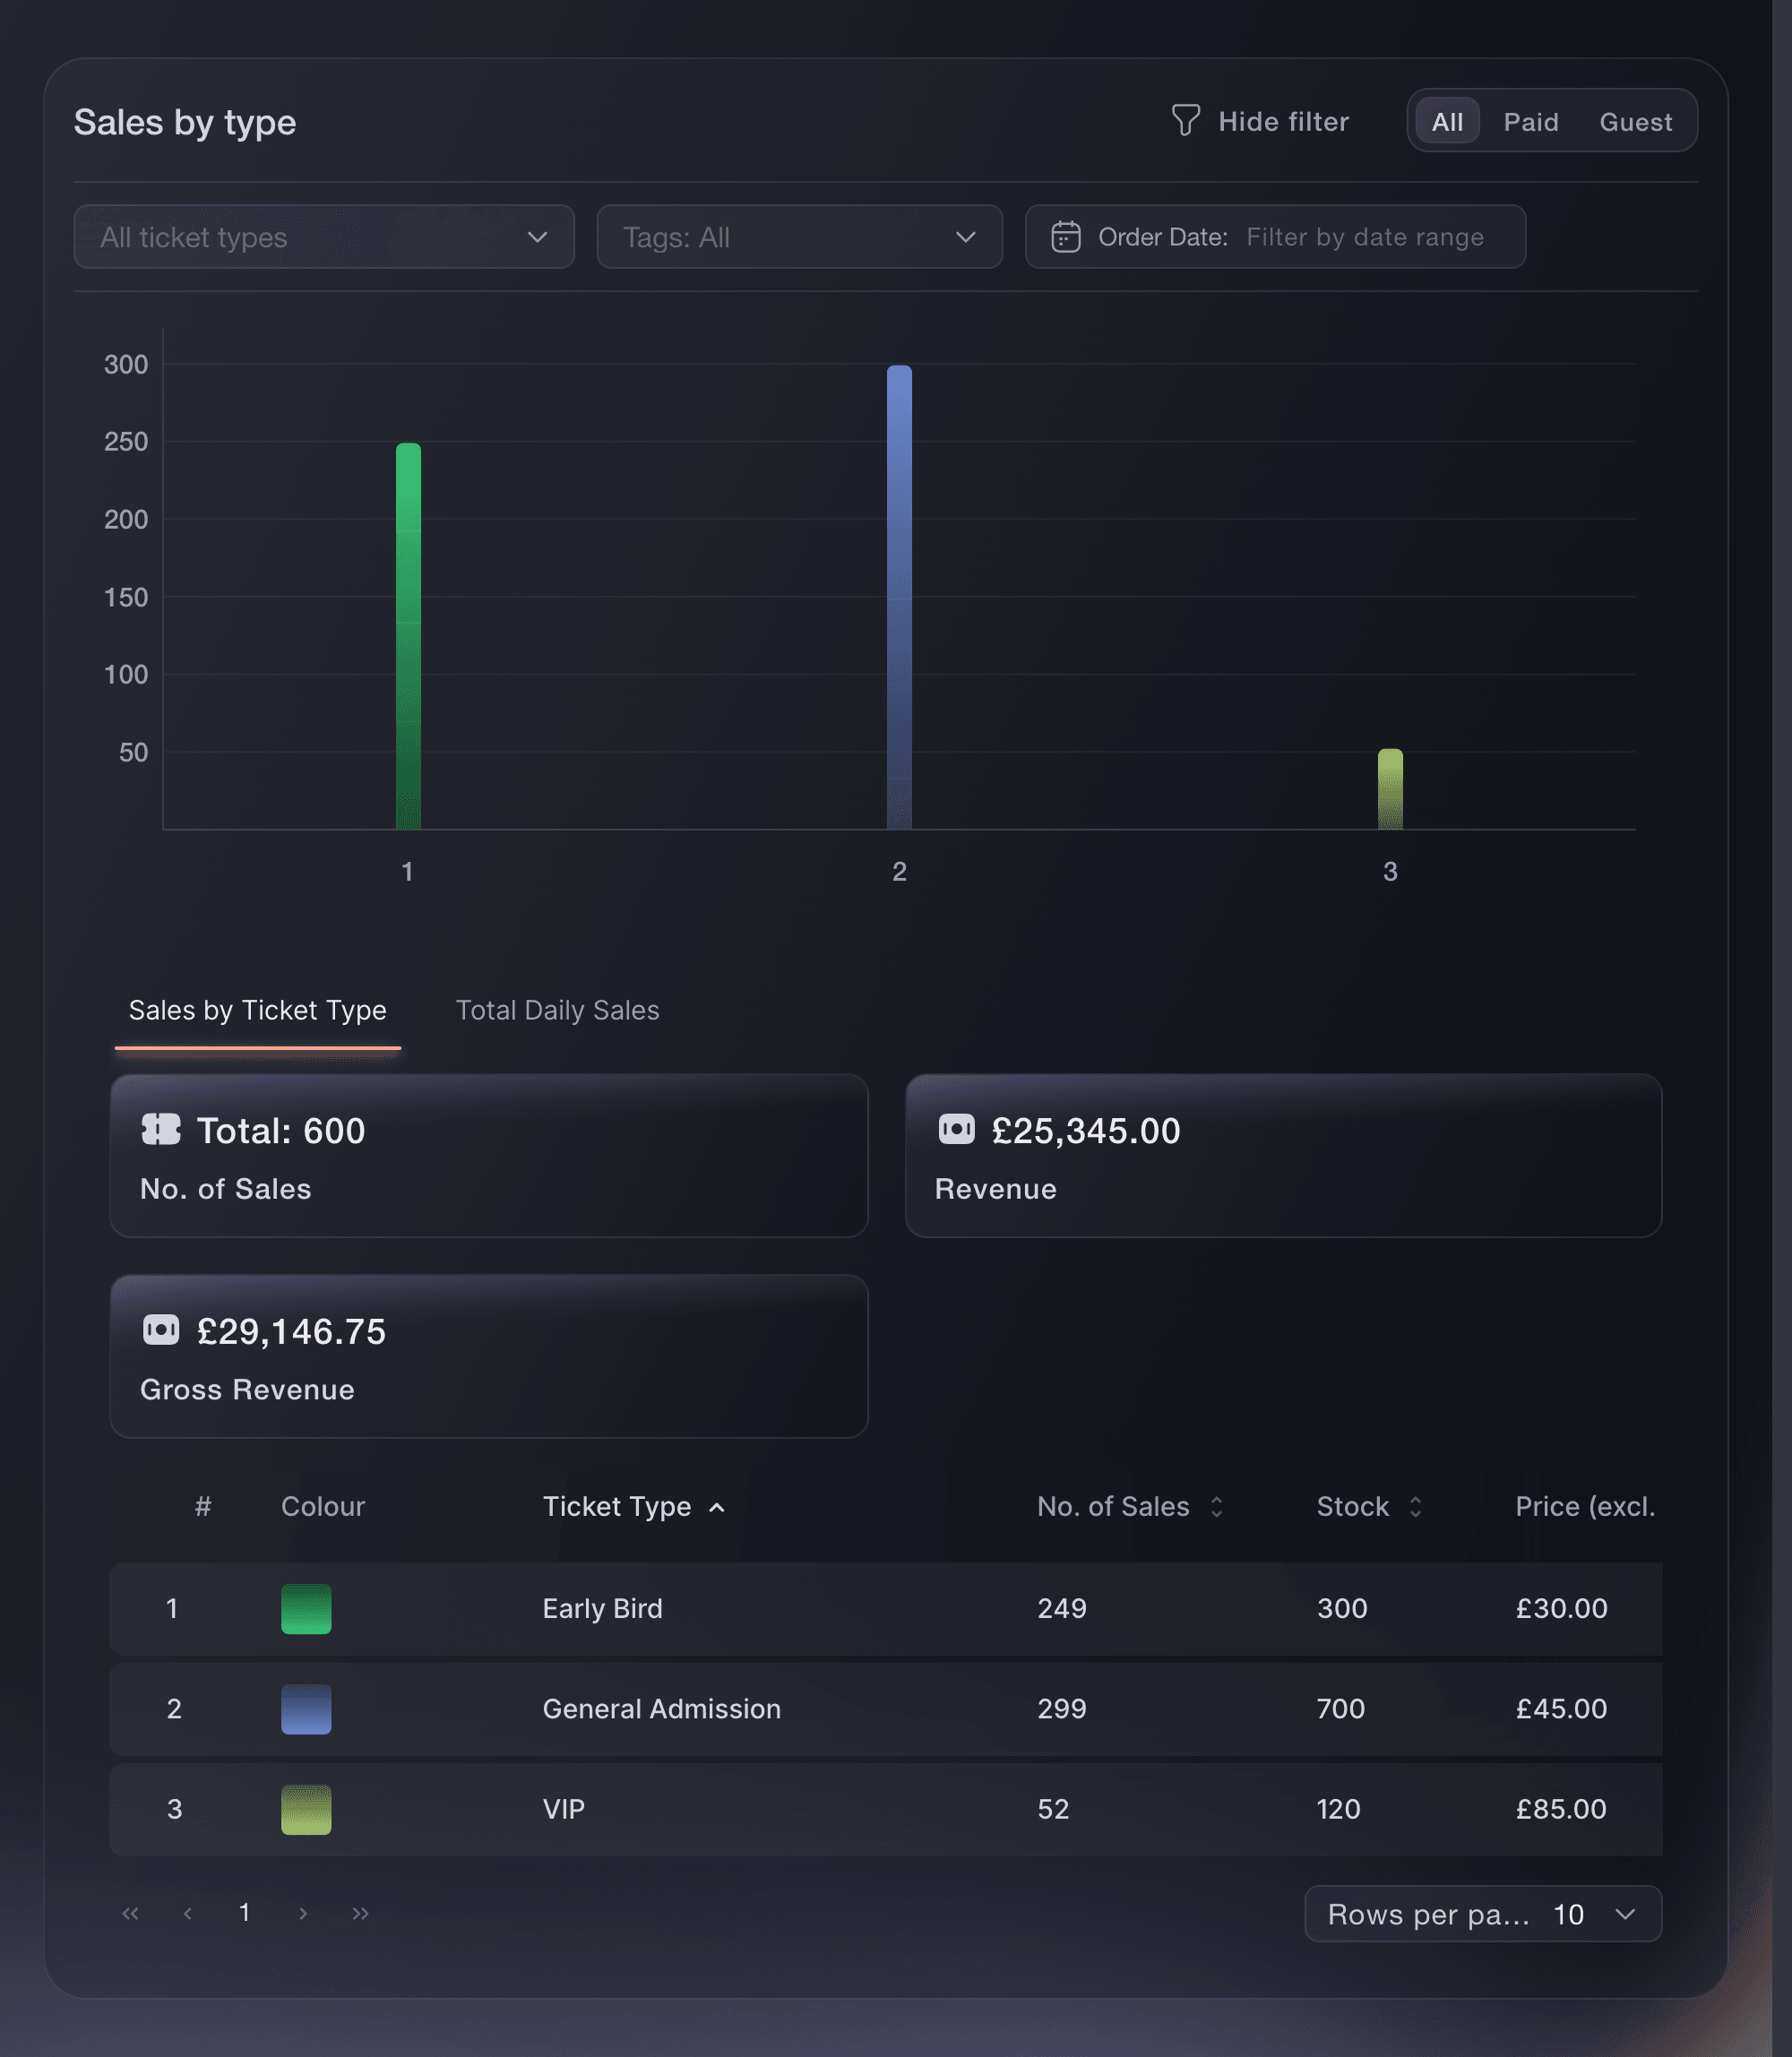
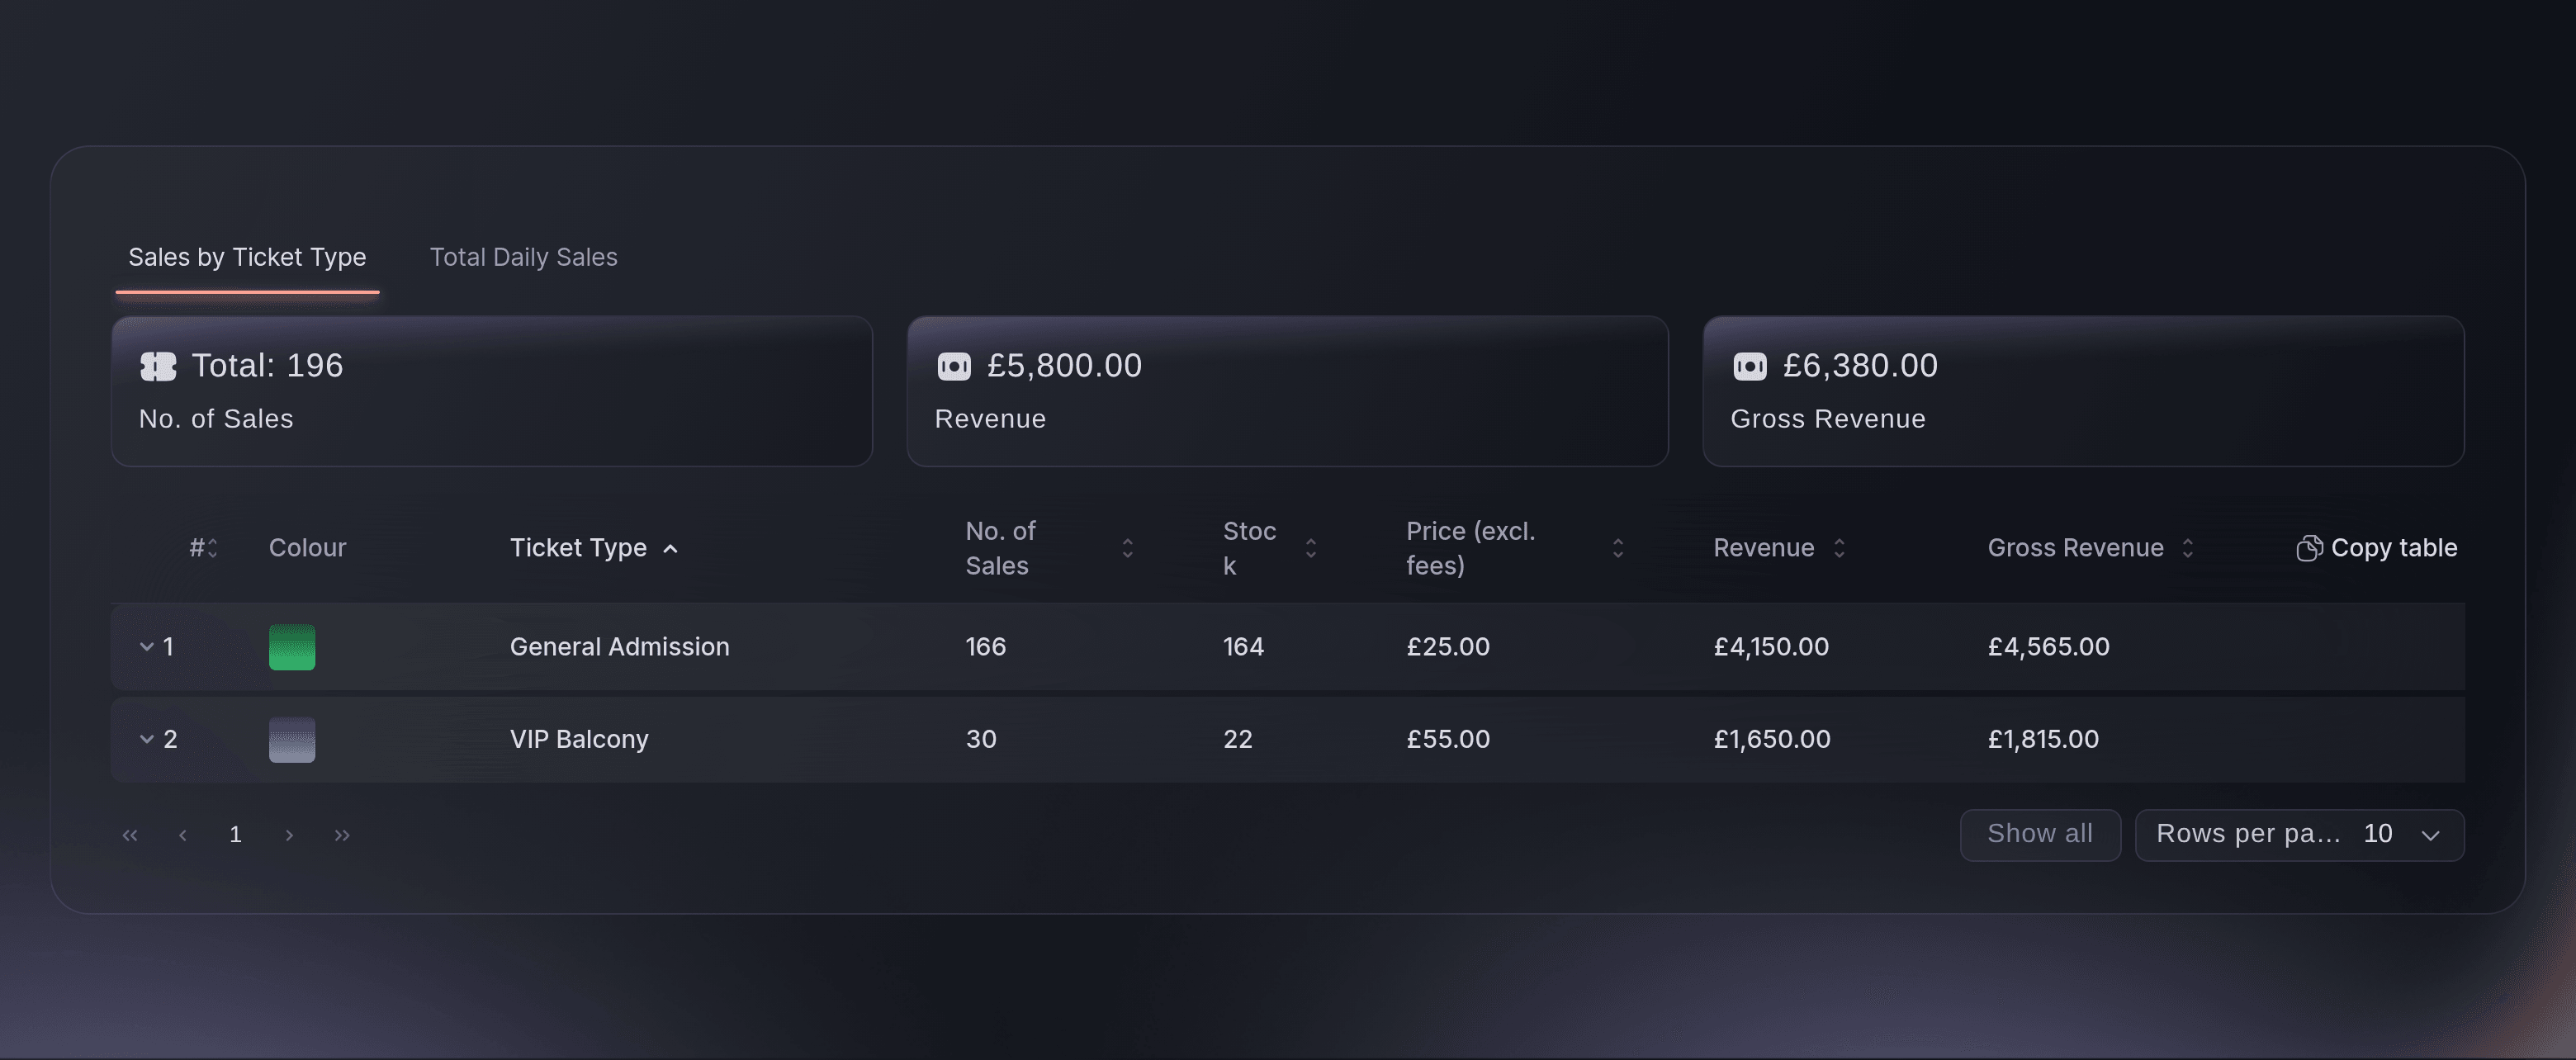
Sales by Type gives one row for every ticket type, with what it has sold and what it has brought in, including a release no buyer has taken yet. See when early bird is close to gone, which tier buyers prefer and which release is not moving, then open, close or reprice your releases with the figures in front of you. Switch the view to By Date or By Time Slot when you sell several days or timed entry.

Ticket Sales gives one row per day with the tickets sold, the revenue and running totals, so the last row is your total so far. The chart above it plots the same run by day or by week. Narrow both with Filter by date range to the days of a campaign or an announcement and see what it did for your sales.

  • Sales by Type: what each ticket type has sold and earned
  • Ticket Sales: one row per day, with running totals
  • Filter by date range: the table and the chart for the dates you choose
Ticket Fairy Sales by Type tab showing how each ticket type performed for an event

Know What You Keep and Where Every Sale Came From

Gross Revenue is the ticket price before sales tax, and Revenue is what you keep of it under your fee agreement, with refunds already taken off both. Net revenue at the top takes off referral rebates and adds add-on and guest revenue, and box office sales have a figure of their own. Each tab across the top is its own report, so the sales behind any part of your event sit beside the totals.

Sales by Promo Code and Sales by Promoter show what each code and each member of your sales team brought in, Add ons and Payment Plans show what sold on top of tickets and what buyers still owe, and Box Office Sales covers the door. Sales by Password, RSVP, Pre-Registration, Waiting List, Ticket Resale and Additional Charges each have a report of their own. Demographics, Psychographics and Geographics show who your buyers are, so start from the report closest to your question and you often have the answer before you export anything.

  • Gross Revenue and Revenue: the ticket price, and what you keep of it
  • Promo codes and promoters: the tickets and revenue each one brought in
  • Box office, add-ons and resale: door sales, extras and the tickets fans resold

See Whether You Are Ahead of Last Year

Compared with last time sets this event against your last edition at the same number of days before each event, and says in one sentence whether you are ahead, behind or level. Ticket Fairy suggests an earlier event of yours with a similar name, about a year before or at the same venue, and you can choose another. Compare by tickets or by share of capacity when the venue changed size.

Beside the sentence sit the tickets sold, the share of capacity sold, last time's total and the no-shows. While the event is on, the fourth figure becomes the people checked in so far against last time at the same hour. After the event, the final sentence says how many more or fewer tickets you sold, and Arrivals by time from the start shows how the two crowds came through the door. The same comparison sits on Today in your event's Operations page, so your team sees it every morning.

  • Compared with last time: ahead, behind or level at the same point
  • % of capacity: a fair comparison when the venue changed
  • No-shows and arrivals: how the two crowds came through the door
Ticket Fairy Compared with last time for a summer festival, ahead of last year, with tickets sold, share of capacity, last year's total, no-shows and the sales and arrivals charts

Replay Your Ticket Drop Minute by Minute

A big on-sale is over in minutes, and afterwards your team wants to know exactly what happened. On-Sale Replay plays your on-sale back from the first cart: carts opening, orders coming in and the moment each ticket type sold out, with a marker on the timeline for each sell-out. Play it at real speed or ten or sixty times faster, drag to any minute, or switch to Live and follow the next drop as it happens.

For each moment of the replay, the counters show the carts opened, the orders placed and the tickets sold so far, with a running count of ticket types sold out. Set the carts against the orders to see where buyers held tickets without completing, and see how long early bird lasted before the next release opened. Use the answers to size and time each release for your next on-sale.

  • Replay and Live: play the on-sale back, or follow the next one as it runs
  • Sell-out markers: the moment each ticket type sold out
  • Carts and orders: for each interval of the on-sale

Share Live Sales With Your Venue and Partners

Venues, co-promoters and sponsors all want to know how many of the tickets they share in have sold. Make a sales report link for the ticket types and add-ons a partner has a stake in, and they follow the number sold, the stock left and the revenue themselves, without a role on your event. Hide the day-by-day sales to share totals only, and give each partner a link of their own.

If a link is passed on, Regenerate Link stops the old one at once and gives you a new one to send to the people who should keep access. Show Selection tells you what any link covers, and you can delete a link the moment a deal ends.

  • A link for each partner: the ticket types and add-ons each deal covers
  • Hide Breakdown by Date: share totals only
  • Regenerate Link: stop the old link and send a new one
Ticket Fairy External/3rd-Party Sales Reporting section with the form to make a sales report link and a table holding one link

Answer Any Sales Question From the Orders Behind It

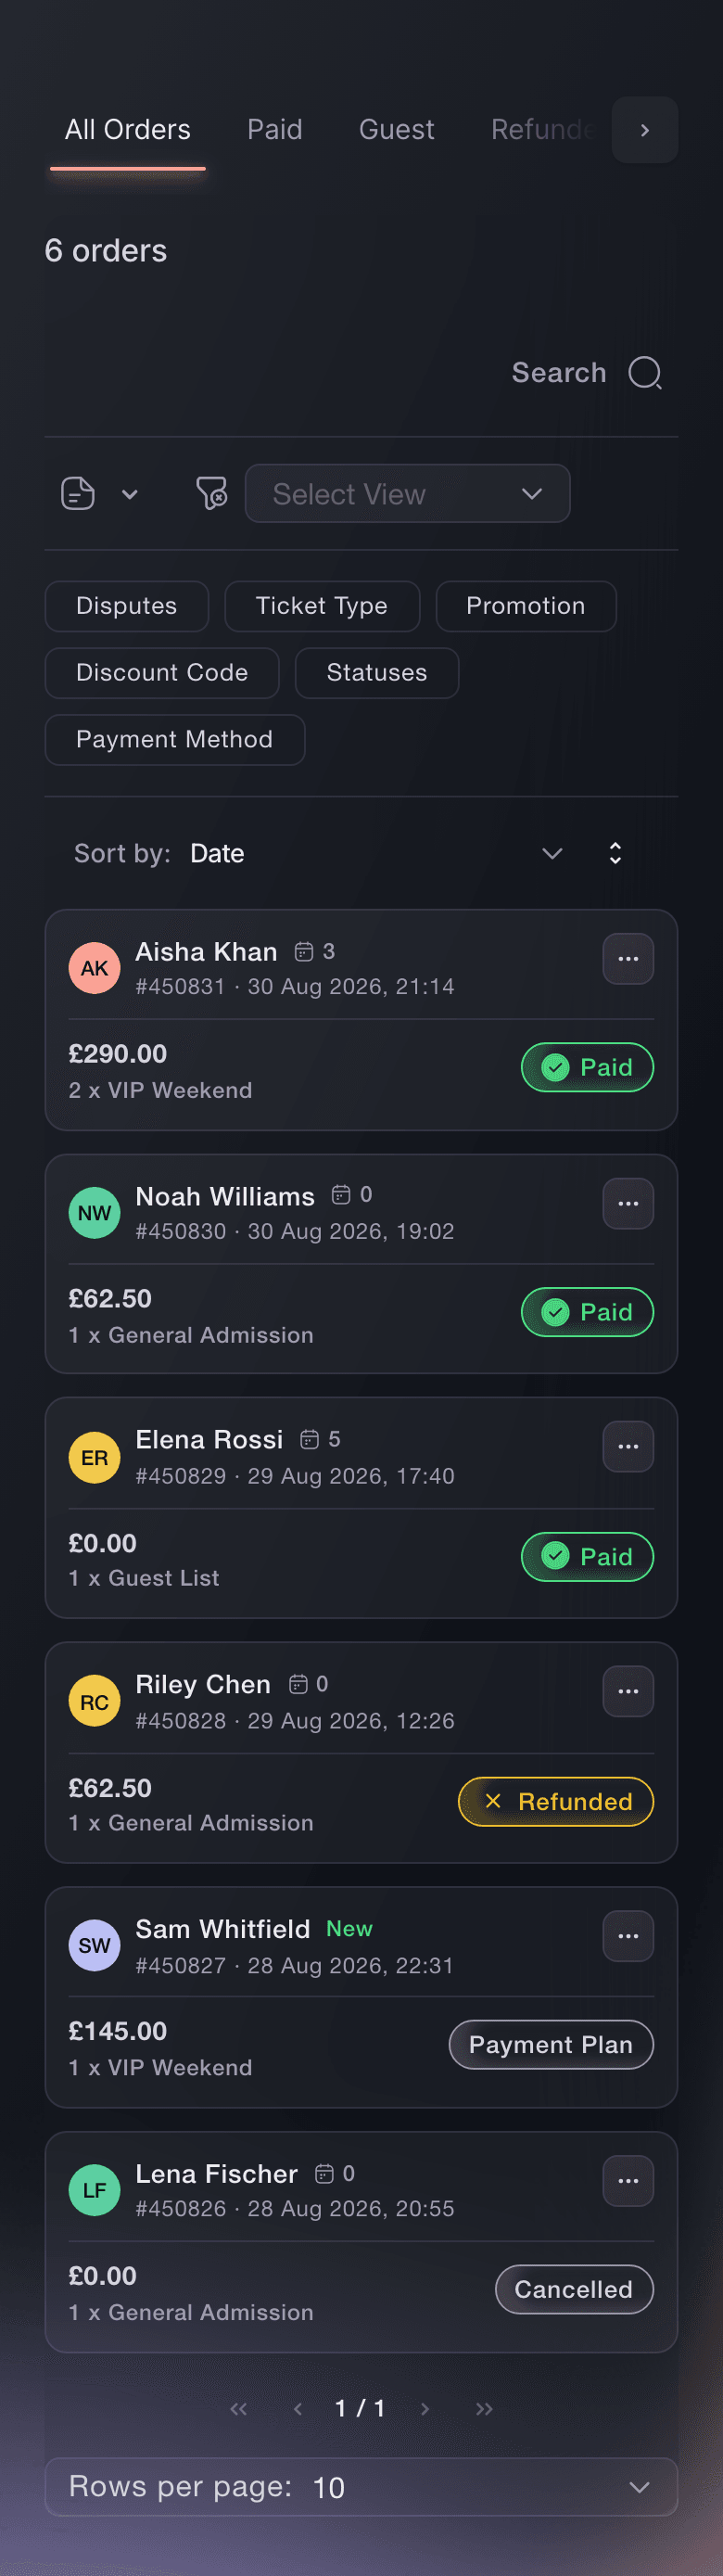
When no report answers a question on its own, filter your event's Orders table until the rows left are the orders you mean: by ticket type, add-on, promotion, discount code, referral link, status, payment method or new and returning buyers. Combine filters with is and is not, and save the set as a view for next time. Then export one row per order, or one row per ticket, and take it into a spreadsheet, a BI tool or your finance system.

Export to CSV gives one row per filtered order, with the promoter or buyer who sold or referred each one, and Export Filtered Tickets and Export all Tickets give one row per ticket. Count transactions from the order export and people from the ticket export. Every table in the reports has Copy table, so you can paste the figures straight into a spreadsheet.

  • Orders filters: ticket type, add-on, code, referral link, status and more
  • Save View: the filters you use every week, one click away
  • Order and ticket exports: one row per order or one row per ticket
Ticket Fairy Orders table with search, status filters, export controls and order rows

Ask Fai How Your On-Sale Is Going

Ask Fai, the assistant inside your dashboard, how many tickets have sold, what the event has earned or which ticket type sold fastest, and she answers from the same figures as your Performance page. Ask her to compare this event with your last few, read back the on-sale replay for the first hour or show the answer as a chart. She can also make a sales report link for a partner once you approve it.

For a report that runs every morning, the Ticket Fairy command line returns the same figures as the dashboard, ready for your own scripts and reporting tools, and your own AI assistant can read them over the MCP server.

  • Ask Fai: your sales in plain words, from the same figures
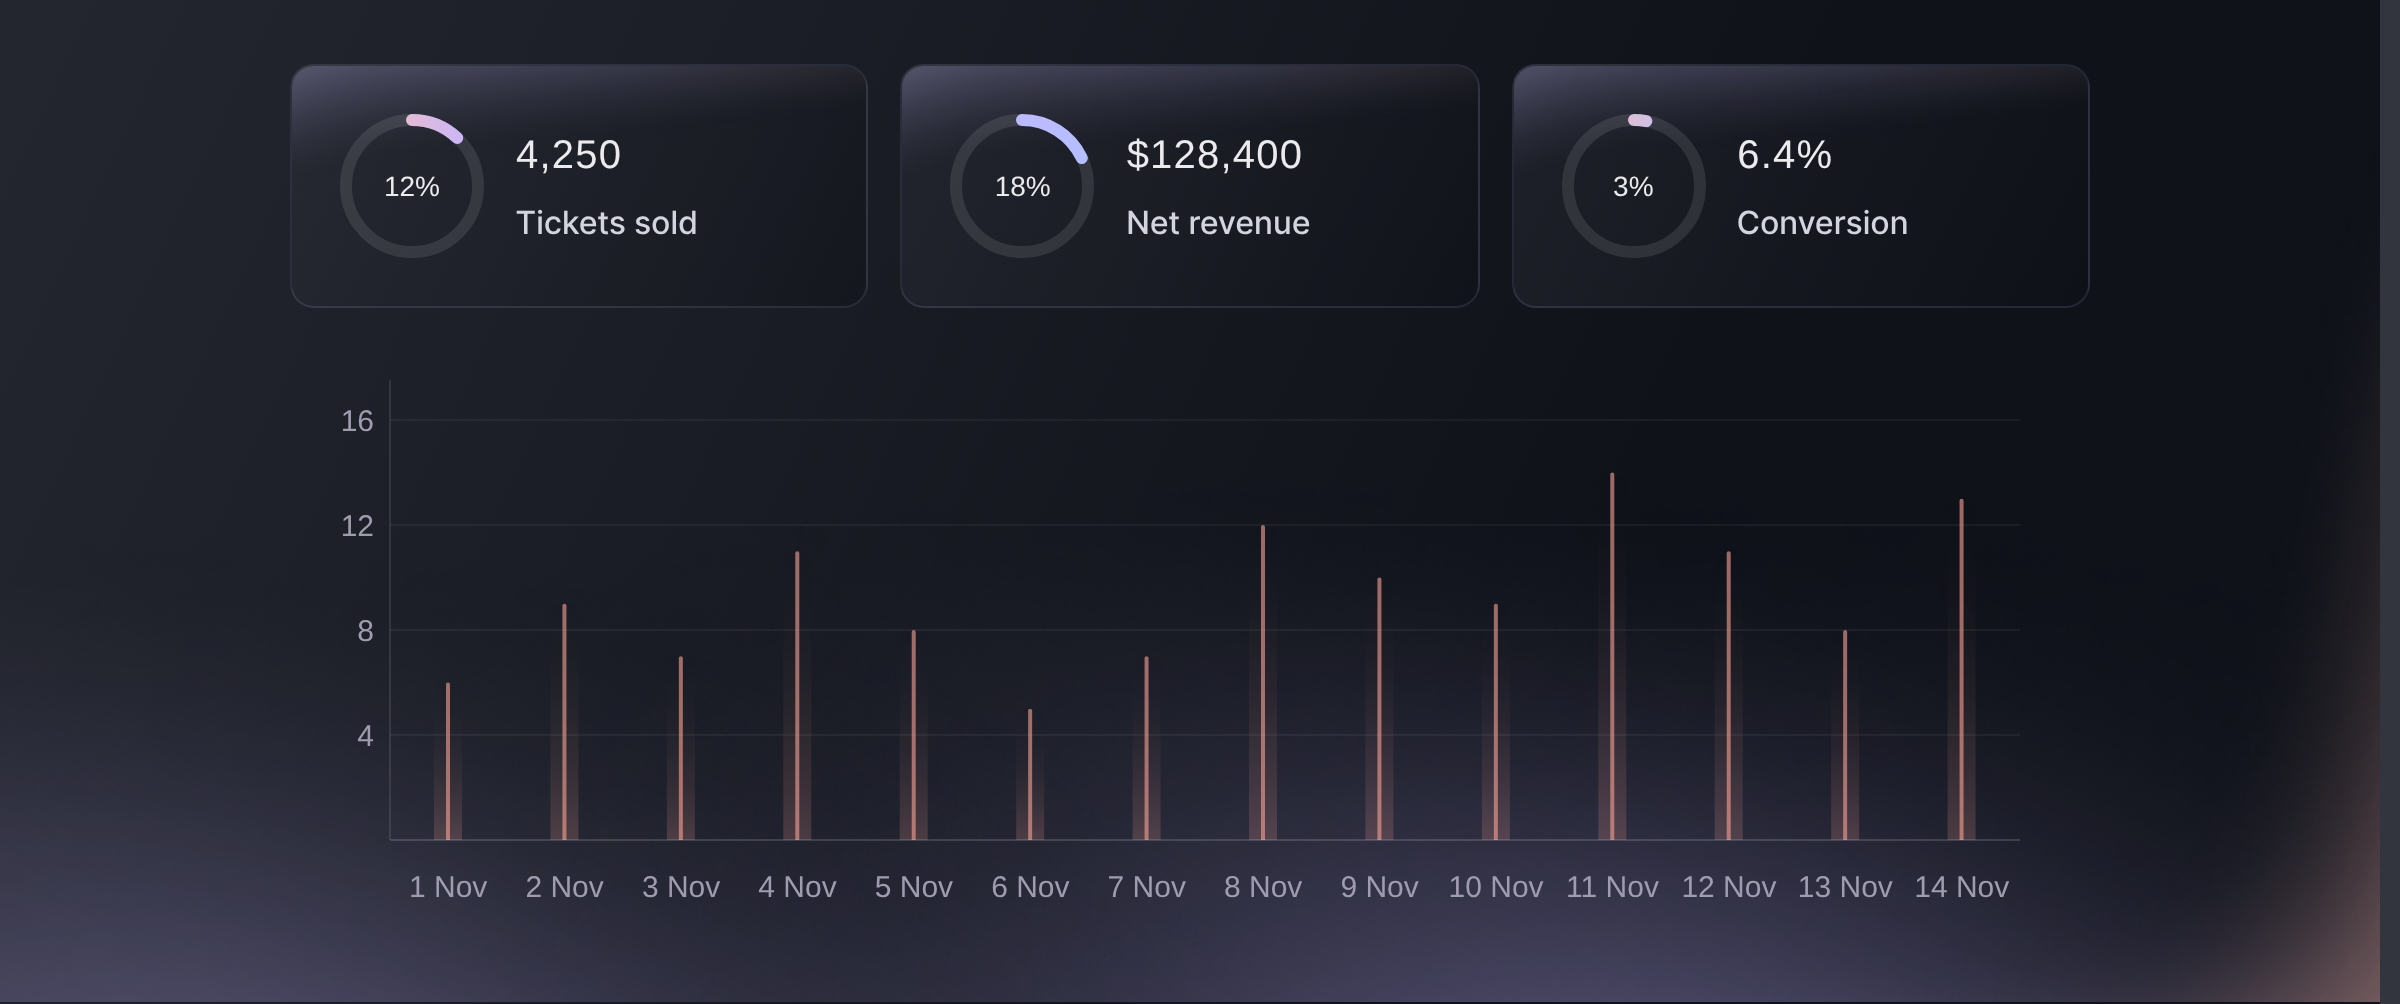
  • Answers as charts: sales by day or by event, drawn for you
  • Command line: the same sales figures for your own reports
Ticket Fairy dashboard with Fai answering with a bar chart of tickets sold per day, with her summary above it

How Organisers Use Their Sales Reports

  • A Festival Watching Its Big Drop

    A festival team keeps the Performance page open as tickets go on sale and opens the second release when Sales by Type shows early bird nearly gone. The next morning, On-Sale Replay shows when each tier sold out, and the team sizes next year's releases from it.

  • An Annual Event Checking Its Pace

    A conference reads Compared with last time each week and sees it is behind last year by share of capacity in a bigger venue. The team moves its early-bird deadline email forward and watches the gap close.

  • A Venue Partner Who Wants Updates

    A promoter makes a sales report link for the ticket types the venue shares in, with the daily sales hidden. The venue follows the totals itself, and the promoter stops sending figures by email.

  • A Finance Team Closing the Month

    A finance lead filters Orders to paid orders bought with one promo code, saves the filters as a view and exports them to CSV. The same view gives the same figures next month in seconds.

Get this page as a PDF Read it later or share it with your team. We email you a link to the PDF.
What to put in your PDF

We will email you this deck. We may also email you now and then about Ticket Fairy features that can help your events. You can unsubscribe at any time with one click.

Questions About Ticket Sales Reports

Live sales & reports

About every five seconds while the page is open in front of you. It pauses while the browser tab is in the background. There are no sales alerts, so keep the page open when you need to watch a figure.

Ticket Sales leaves complimentary orders out and Sales by Type counts them, so where you issue guest, artist or crew tickets, Sales by Type is the larger figure. Ticket Sales also counts tickets held but not yet paid for. Refunded tickets drop out of both.

Net revenue takes referral rebates off, adds add-on and guest revenue, and keeps box office sales in their own figure. The footer of the Net revenue card names whichever of those apply to your event.

Your own brand's earlier events only, never another brand's. To see last time's figures you need access to that event too, and to change which event it compares with you need an owner, admin or producer role. Before your event, No-shows says Not yet.

The replay starts from the first cart a buyer opened for your event. Live shows the last hour in one-minute steps. A ticket type gets a sell-out marker when its sales reach its capacity, so a ticket type with no quantity set has no marker. Quote tickets sold as your final figure, and read carts opened as demand.

Yes. Your partner signs in with a Ticket Fairy organiser login of their own when they open the link. They do not need a role on your event and they see only the report, which refreshes every ten seconds. Anyone signed in to Ticket Fairy who has the link can open it, so send it only to the person it is for.

No. A link keeps the ticket types, add-ons and date setting it was made with. Make a new link with the new choice, send it, then delete the old one. The partner's report also counts guest tickets on those ticket types at no price, so its ticket count can differ from your Performance page.

An order export has one row per transaction, and a ticket export has one row per ticket. One order can hold several tickets and one attendee can hold more than one ticket, so remove duplicate people before you use either export to count attendees.

With an owner, admin or Stats login you see the whole Performance page, though Gross Revenue is hidden from a Stats login unless it is enabled for your account. A Limited Stats login sees Ticket Sales with no money columns, and a promoter sees only their own sales. On-Sale Replay opens for owners, admins, Stats and Limited Stats logins.

You need an owner or admin login on the event to make a sales report link and to export tickets or add-ons from Orders. You can open Orders with an owner, admin, Stats or support login, and a limited support login sees orders only after a search.

Sell more tickets. Build the crowd that comes back.

Start Selling Tickets Online

Sign up without a credit card and build a test event before you commit. Go on sale in minutes when you are ready.

No monthly subscription required for ticketing
Start selling tickets immediately
Ticketing tools included in the service fee
Get Started Talk to Fai Now

Ask Fai, our AI assistant, about Ticket Fairy’s features, pricing and how it could work for your event.

No credit card required

Book a demo call

See the referral model that drives 20% more ticket sales on average, learn which campaigns sell tickets, answer buyers faster and keep queues moving.

45-Minute Video Call
Pick a Time That Works for You