1. Features
  2. Sales reports
  3. Traffic & weather

See Where Your Buyers Come From and What the Weather Will Do

Every advert, post and newsletter you pay for sends people to your event page, and only some of them buy. The Traffic report shows how many visits your page gets, which sites sent them, the language and device each visitor uses and how many reached your order confirmation page. Beside your sales on the Performance page, Weather intelligence shows the forecast at your venue, any severe-weather warning and what your date is usually like, so you time your marketing and your plans around both.

  • The sites that send you visitors who buy
  • Your event page checked on the phones your visitors use
  • The forecast and warnings at your venue beside your sales
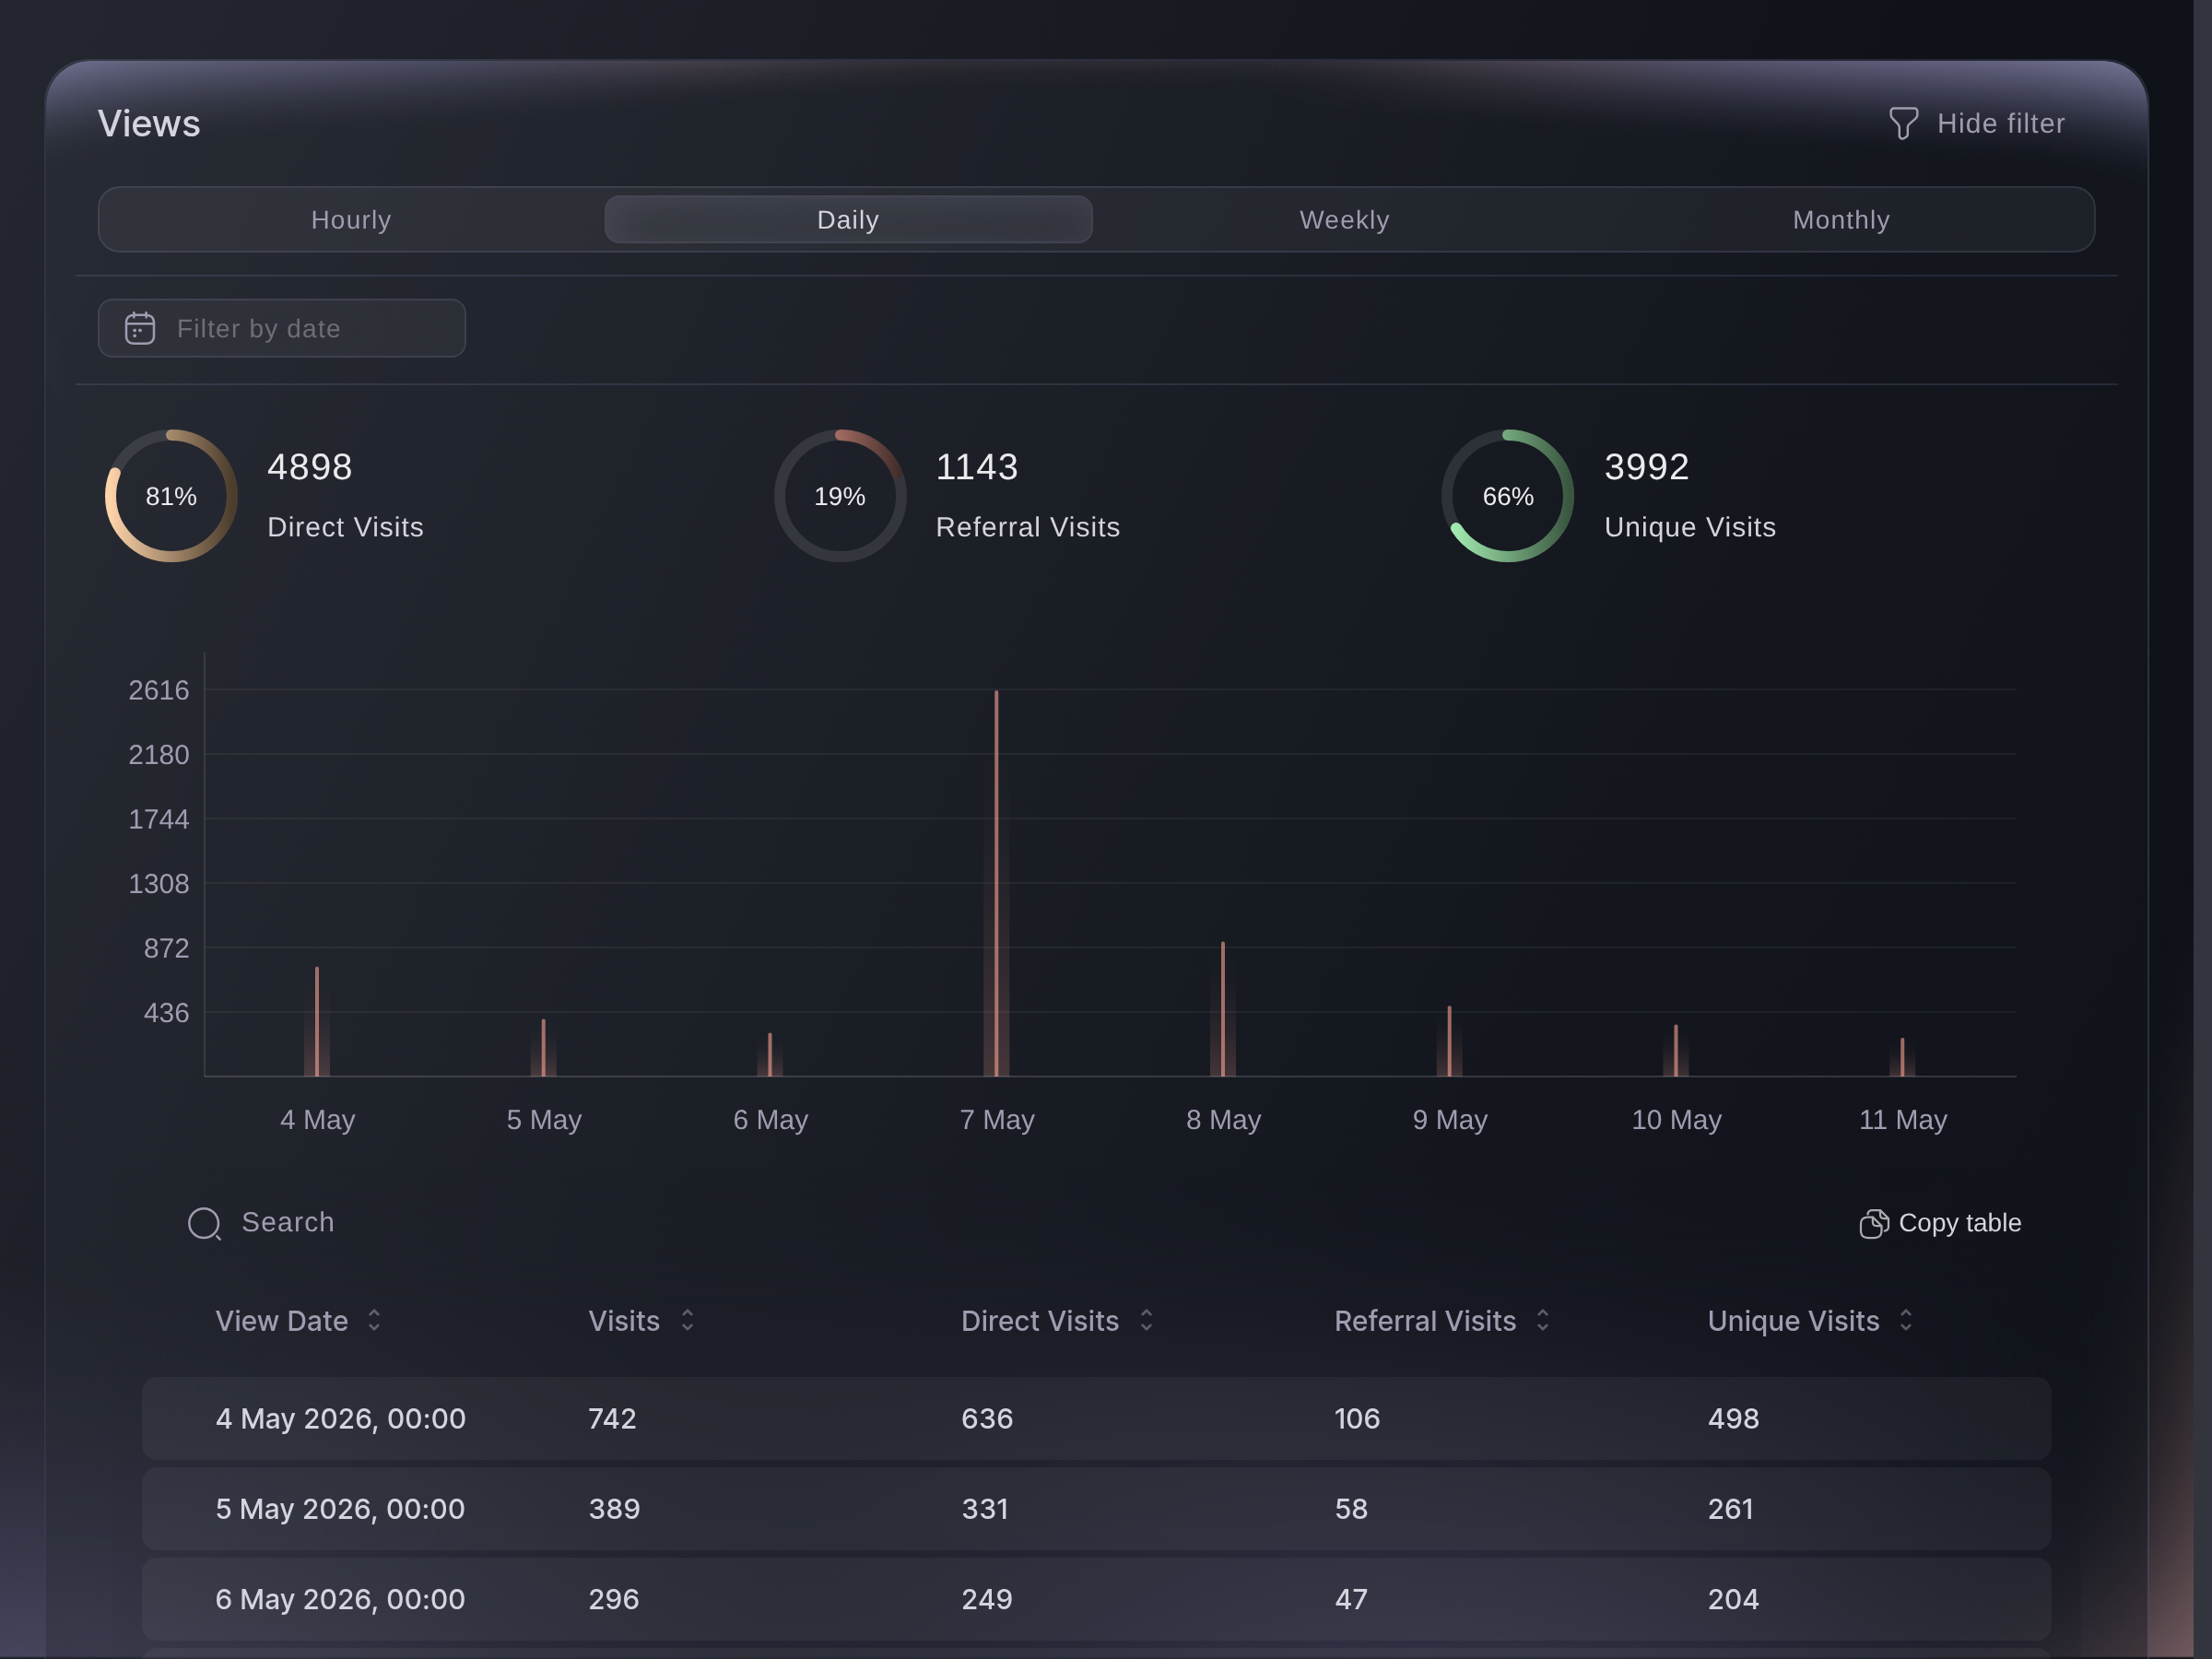
Ticket Fairy Views section of the event Traffic report, with direct, referral and unique visits above a chart of visits by day

See How Many People Visit Your Event Page

Views counts every opening of your event page and splits the visits into direct visits, visits through a buyer's referral link or a promoter's link, and unique visits. Look at the visits hour by hour on the morning of an announcement, or week by week across the whole run, and narrow every figure to the dates you choose. Switch to Pre-Registration Traffic to see the same report for your pre-registration page before the on-sale.
A spike in referral visits after your on-sale tells you buyers and promoters are sharing. A spike in direct visits on the day a line-up announcement goes out tells you the announcement worked, because your own posts, emails and tracking links all count as direct visits.

  • Views: visits, direct visits, referral visits and unique visits
  • Hourly to monthly: the visits at the scale that answers your question
  • Pre-Registration Traffic: the same report for your pre-registration page

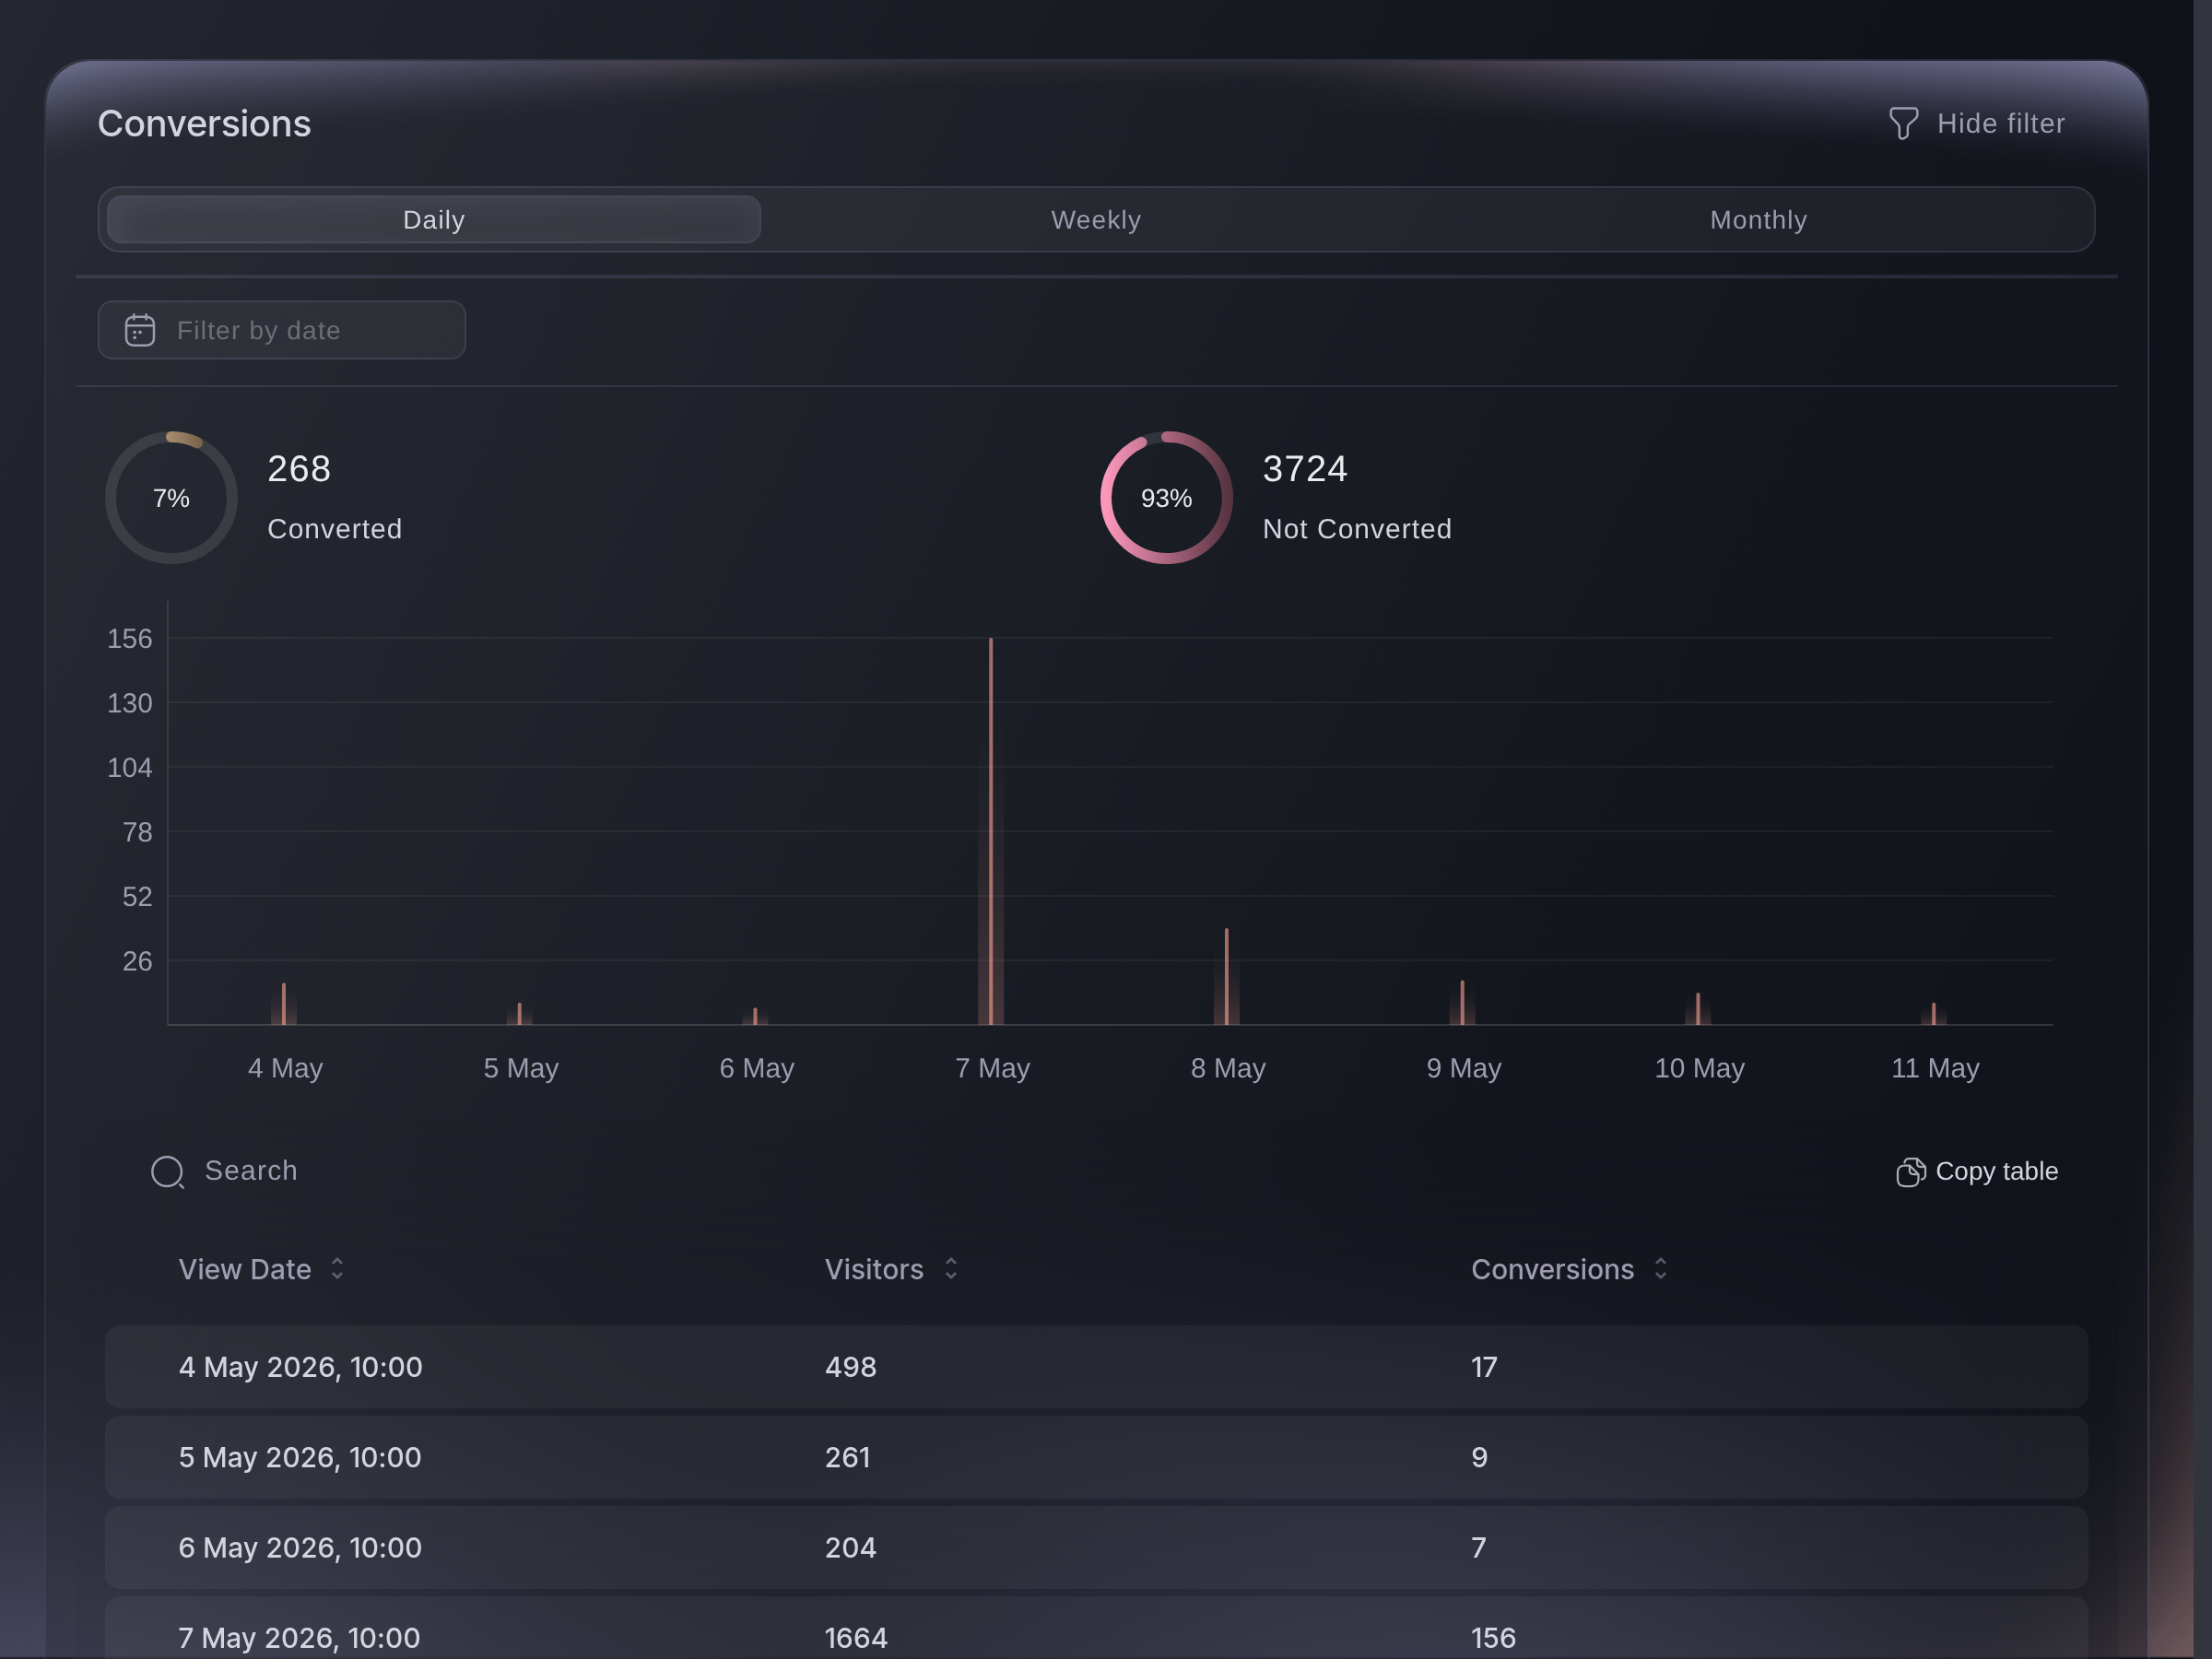
Find Out How Many Visitors Go On to Buy

Conversions shows how many visits reached your order confirmation page and how many did not, day by day. Compare the two before and after a change to your event page, your prices or your line-up, and see whether more of your visitors went on to buy. A busy page with few conversions points at the page or the price, and a quiet page with a high share converting points at reach.

  • Converted and Not Converted: the visits that reached order confirmation and the rest
  • Daily, weekly or monthly: conversions at the scale you need
Ticket Fairy Conversions section, with converted and not converted visitors above a chart of conversions by day

Spend Your Budget Where Your Visitors Come From

Referrer URL lists every site that sent visitors to your event page, with how many each one sent, and Total by Day shows the same sites a day at a time. See whether Instagram, Google, a listings site or a partner's website brings you the most visitors, and move your budget to the places that work. Copy table puts any table on your clipboard, ready to paste into a spreadsheet.

Referrer URL tells you which site a visitor came from. For the visits, orders and revenue from one post, advert or poster, give each placement its own tracking link, and for what each ad network sold, connect your pixels. Ask Fai, the assistant inside your dashboard, where the visits to your event page came from and how many reached order confirmation for the dates you name, and she reads the same figures, including the ones behind each chart.

  • Referrer URL: every site that sent you visitors
  • Total by Day: the same sites, a day at a time
  • Copy table: paste the list into a spreadsheet
Ticket Fairy Referrer URL section, one row per site that sent visits to the event page

Reach Visitors in Their Own Language and Town

Languages groups your visitors by the language set on their phone or browser, and Visitor Locations maps the towns they opened your event page from, with the top cities, regions and countries. When a share of your visitors browses in Spanish or comes from another city, you know which advert to test, in which language, and where to run your next campaign.

  • Languages: the language each visitor browses in
  • Visitor Locations: the towns, regions and countries visits come from
  • Total by Location: each visitor counted once by city, region and country
Ticket Fairy Languages section of the Traffic report, with a ring of visitors by language and a table of counts for each language

Check Your Page on the Phones Your Visitors Use

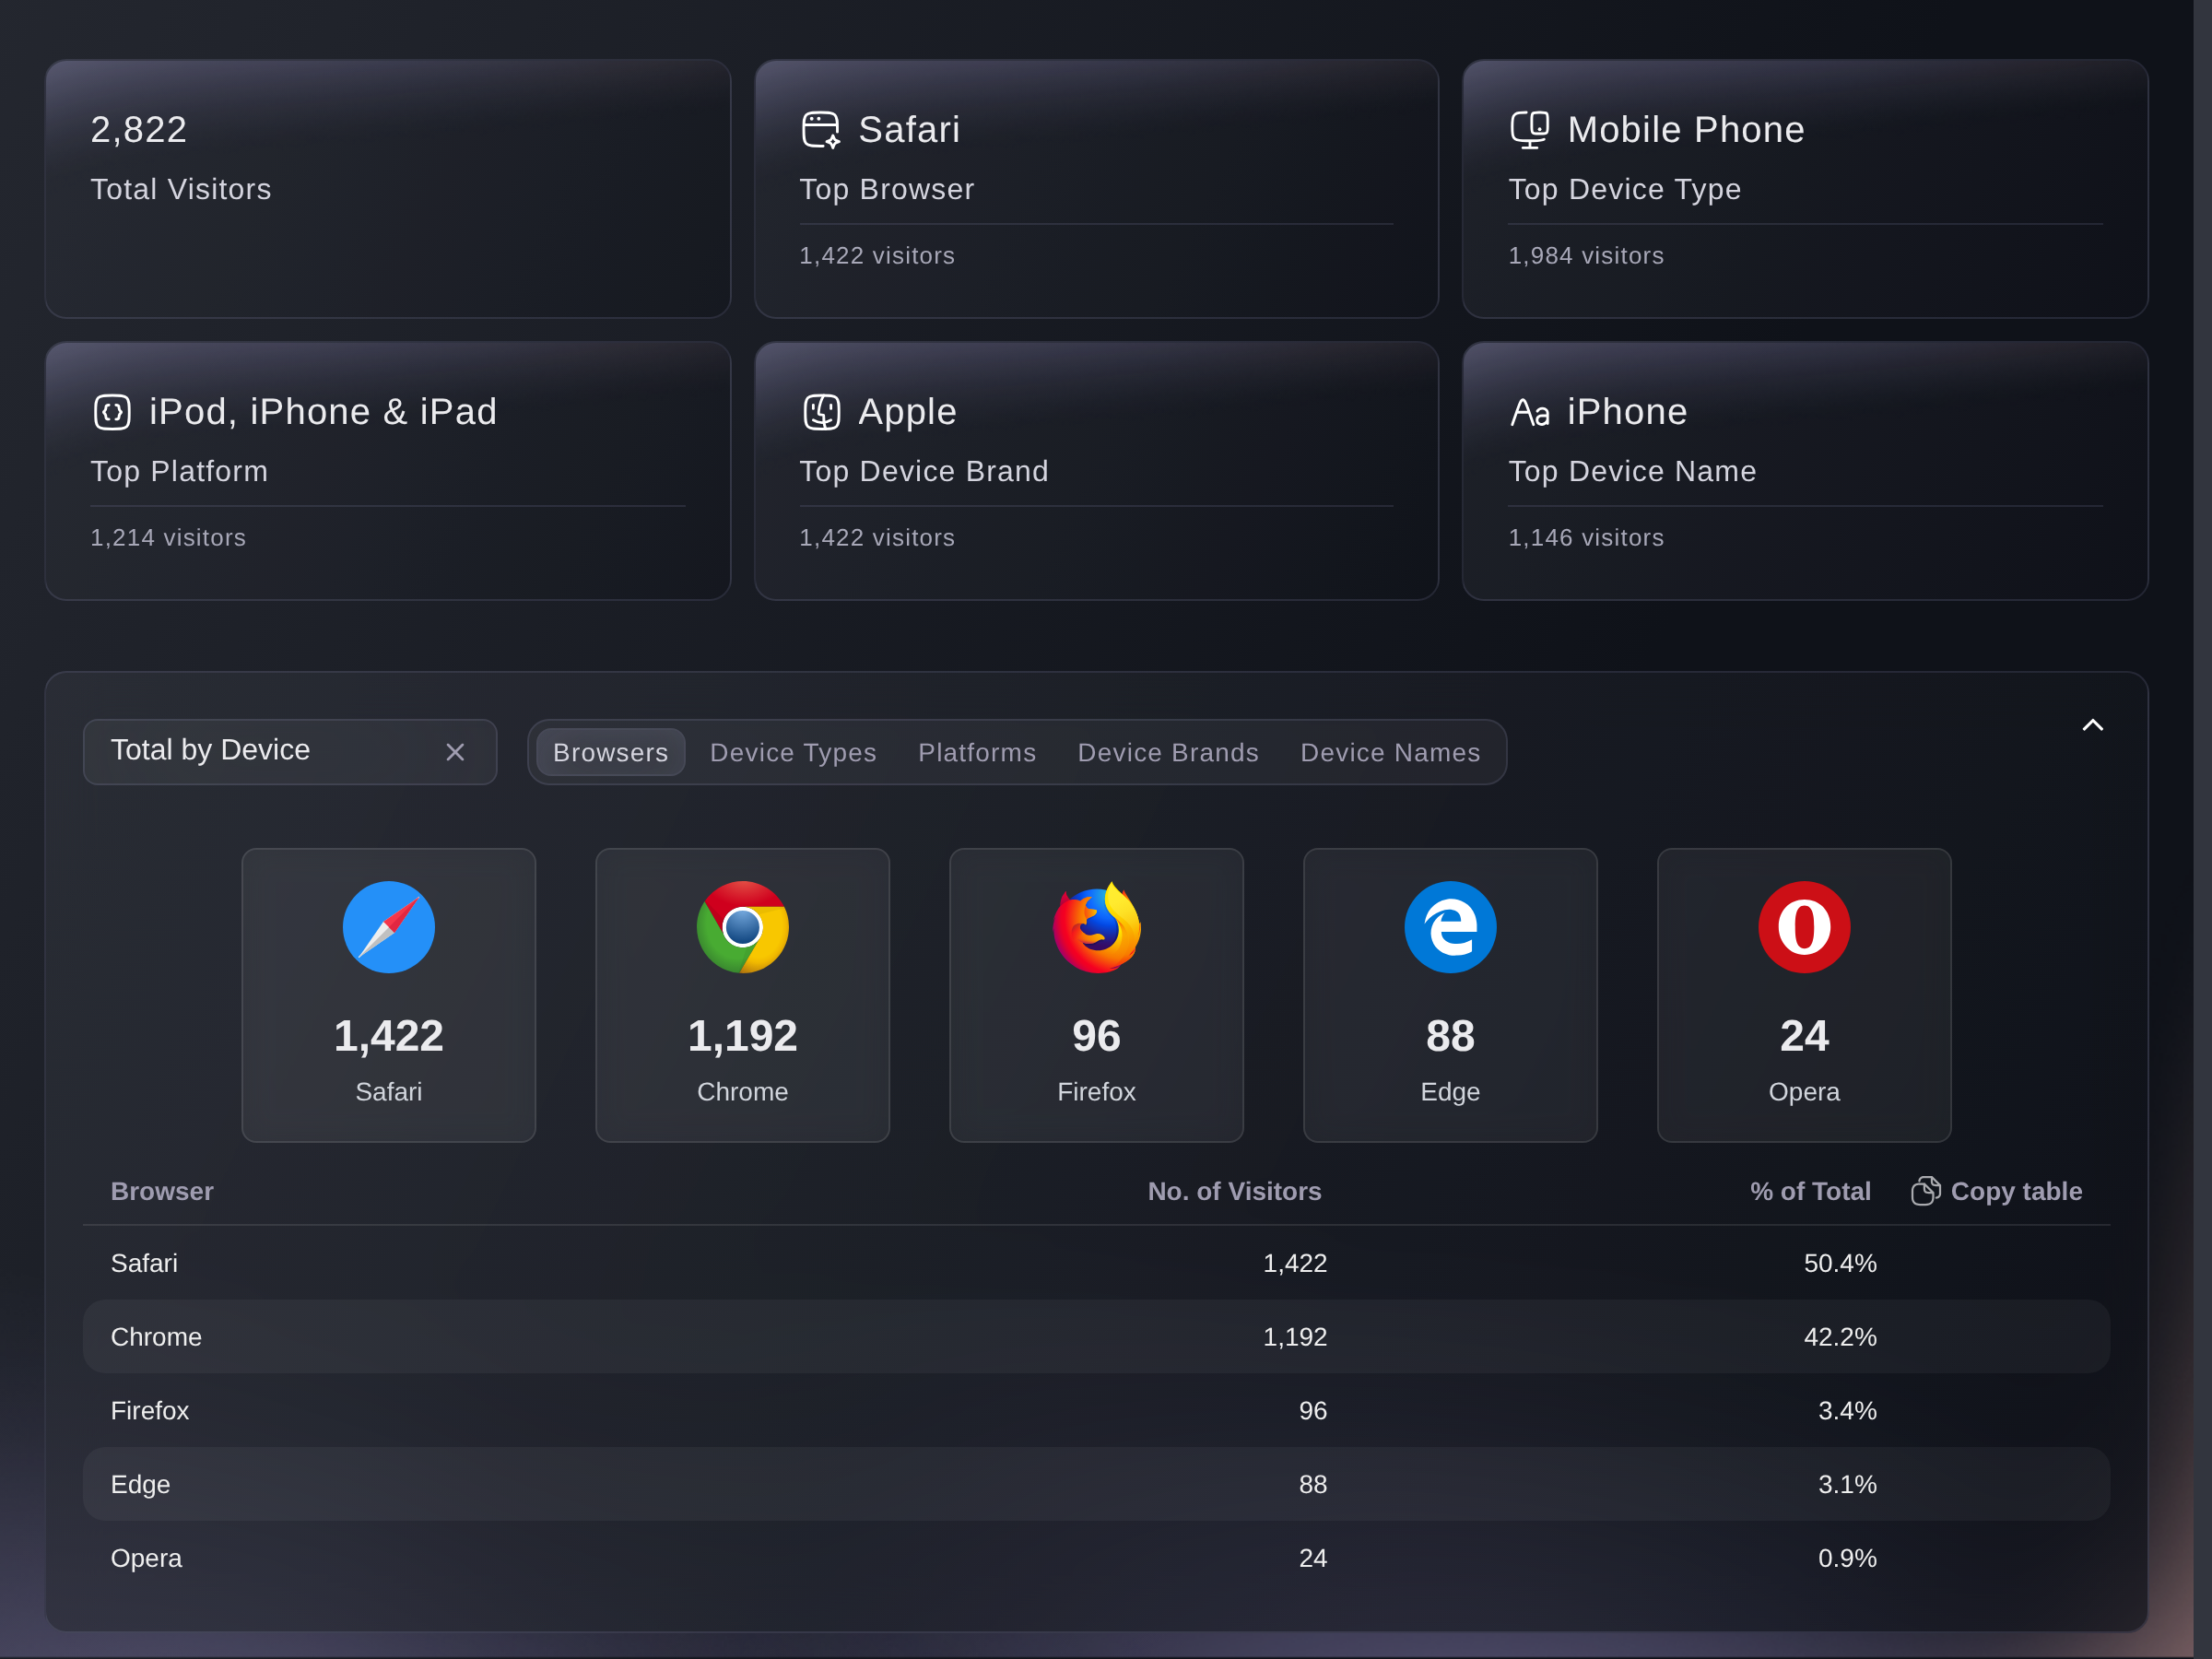
Devices names the most common browser, device type, platform, brand and model among your visitors, with the full breakdown for each. If most of your visitors are on an iPhone, open your event page on one and go through to checkout before you spend more on advertising. The Devices report under Demographics then shows the phones of the people who bought, beside the phones of everybody who looked.

  • Device types and models: the phones, tablets and computers your visitors use
  • Browsers and platforms: the browser and operating system behind each visit
Ticket Fairy Devices section of the Traffic report, with the top browser, device type, platform, brand and model above the full browser breakdown

Time Your Last-Chance Push to the Forecast at Your Venue

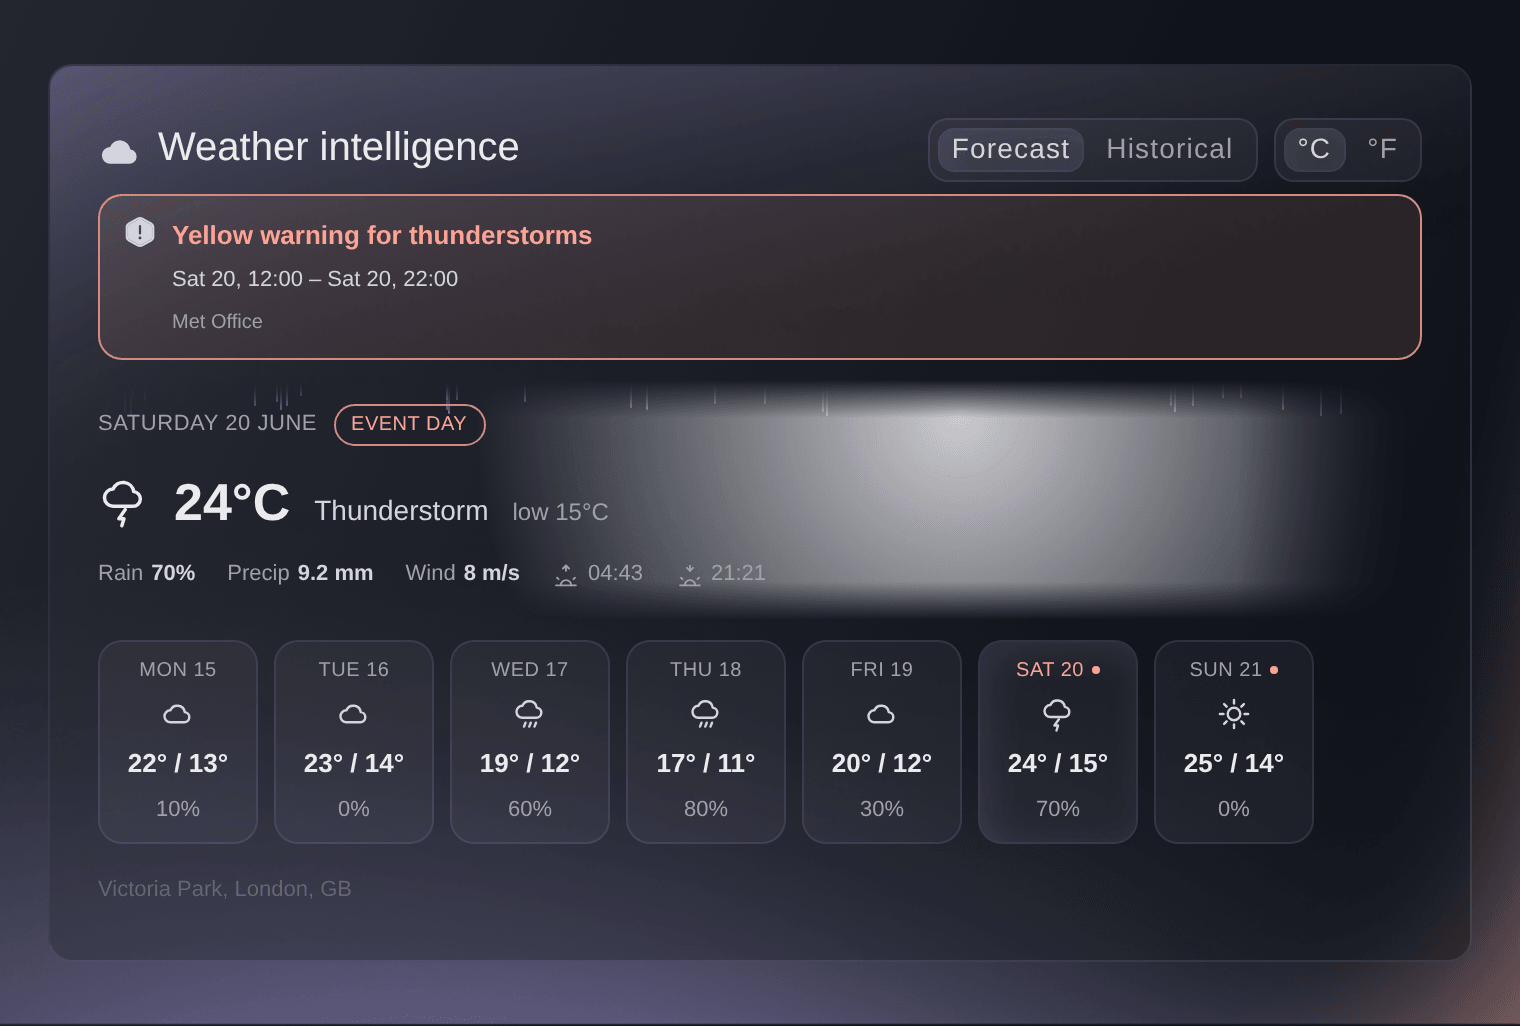
Weather intelligence sits under your sales on the Performance page. In the week before your event it shows the conditions at your venue now and a strip of the days ahead, each with its high, its low and the chance of rain, and a dot beside every day of your event. When the weekend looks bright, put your last-chance post and email out while buyers are making plans. Each day also shows the rain expected, the wind and the sunrise and sunset at the venue, and the card reads in °C or °F.

  • Forecast strip: the days ahead at your venue, with your event days marked
  • Event day: the high, low, rain, wind, sunrise and sunset for each of your days
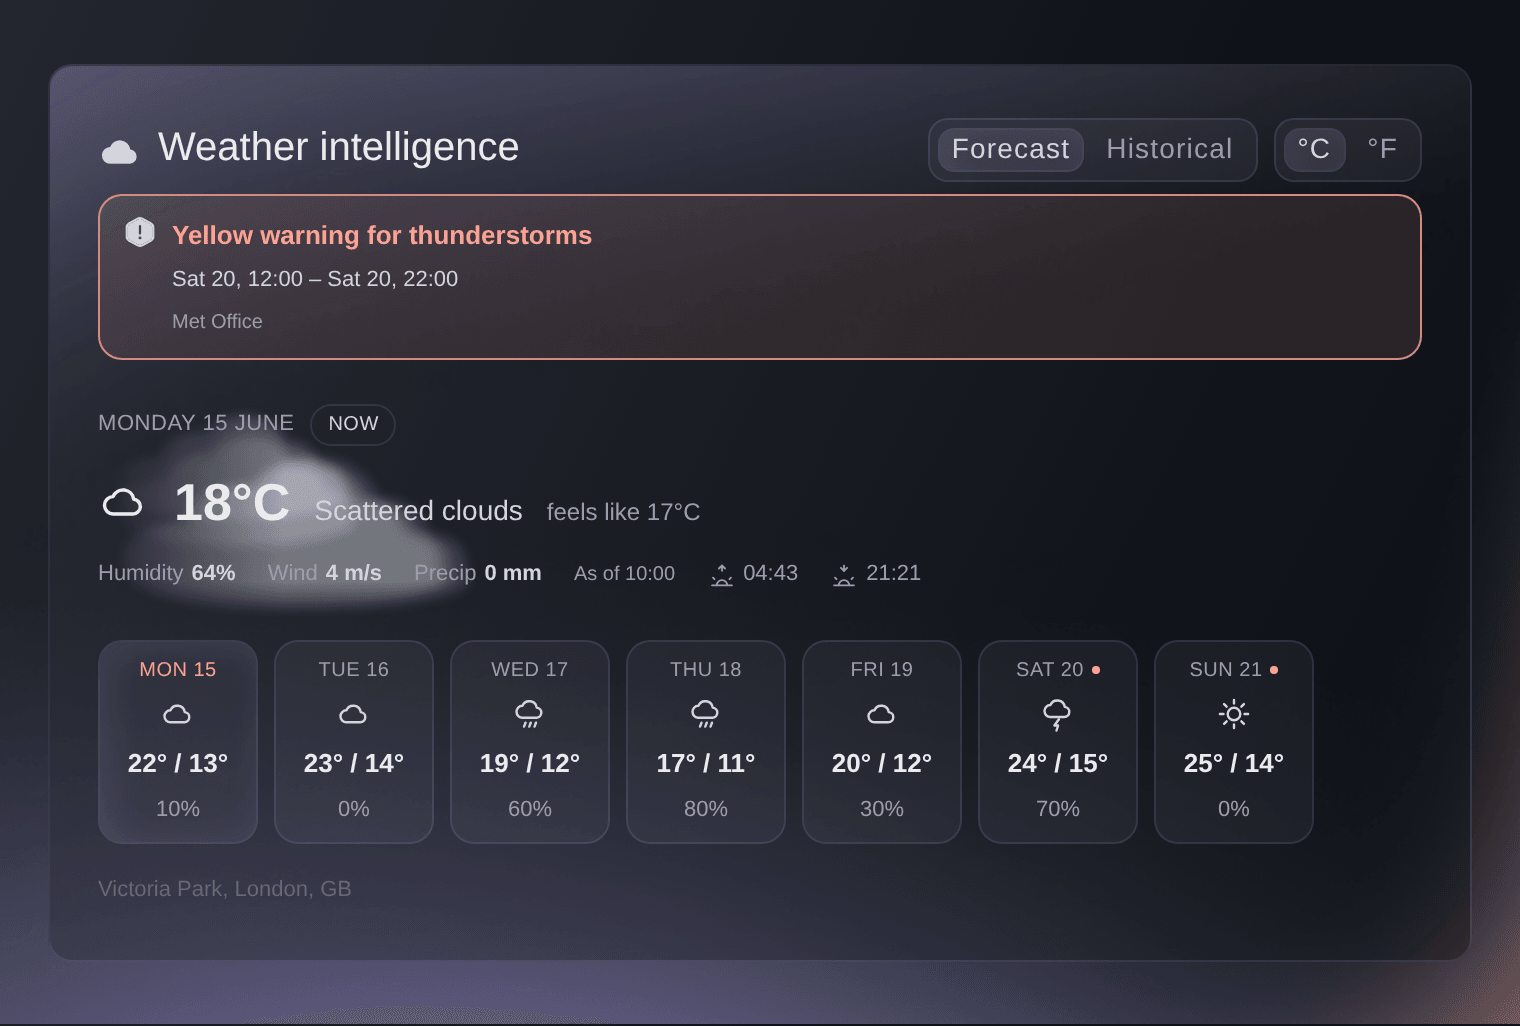
  • Conditions now: temperature, feels like, humidity, wind and recent rain
Ticket Fairy Weather intelligence card with the first day of the event selected, showing its high and low, chance of rain, rainfall and wind

Act Early When a Warning Covers Your Event Days

A severe-weather warning for the area around your venue appears above the forecast, with the hours it covers and the weather service that issued it. Check the hours against your event days, and start your wet-weather plan, your staffing changes and your messages to ticket holders before the questions start coming in. Email the people who hold tickets with what to bring, a new entry time or where to find cover, so buyers arrive ready and your team answers fewer questions at the gate.

  • Severe-weather warnings: for the area around your venue, with the hours they cover
  • Email ticket holders: what to bring and what has changed
  • The right people: everybody with a ticket, or the ticket types you choose
Ticket Fairy Weather intelligence card on the Performance page, with a thunderstorm warning, the conditions at the venue now and a strip of the week ahead

Know What Your Date Is Usually Like, Months Ahead

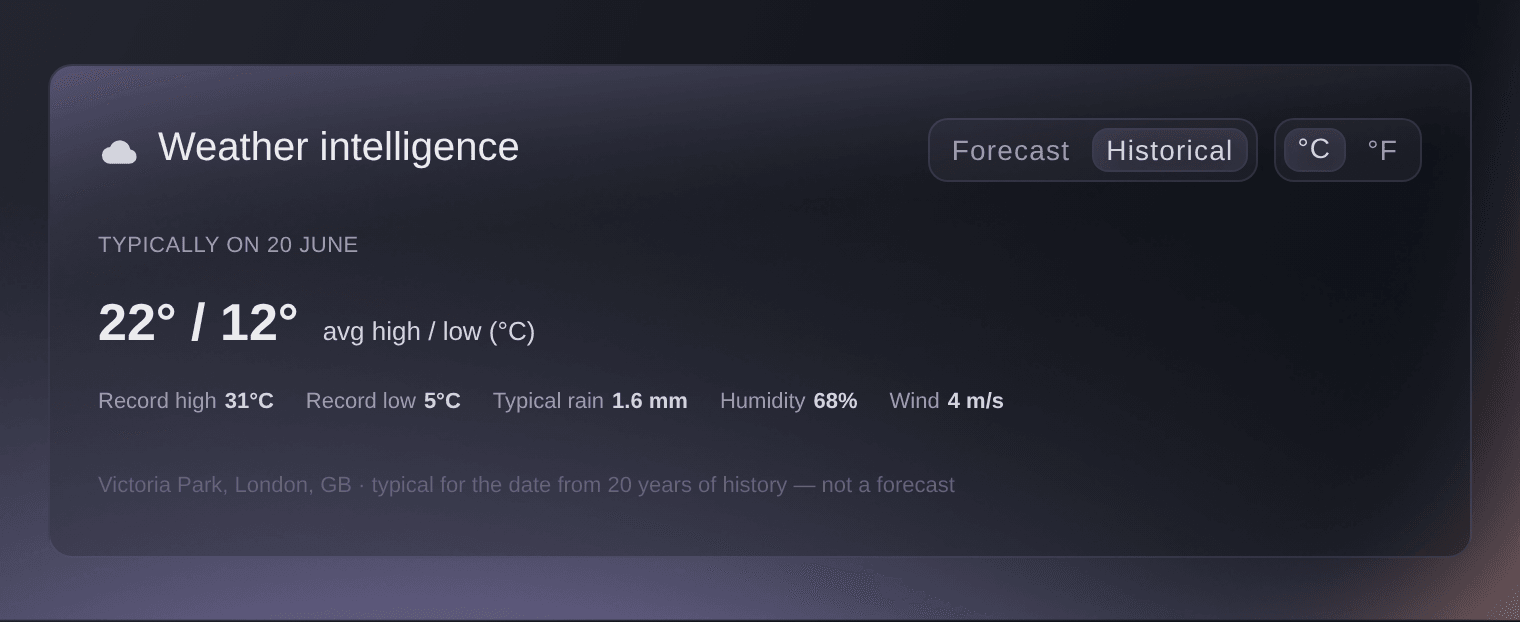
Long before a forecast exists, Weather intelligence opens on Historical: what the first day of your event is usually like at the venue, with the average high and low, the record high and low, the typical rain, humidity and wind. Plan shade and water for a hot date, heaters and cover for a cold one, and choose the extras you sell, such as ponchos, blankets or covered seating, to match.

Ask Fai, the assistant inside your dashboard, what the weather looks like for your event, whether a warning is out for the venue and what the date is usually like there. She reads the same forecast and history for your venue and answers in plain words, ready to pass on to your production team.

  • Historical: the usual weather on your event date
  • Record high and low: the extremes your date has seen at the venue
  • Ask Fai: the forecast, warnings and usual weather in a sentence
Ticket Fairy Weather intelligence card switched to Historical, with the average high and low and the record high and low

How Organisers Use Traffic and Weather

  • A Club Night Testing Its Adverts

    A promoter runs adverts on two networks and checks Referrer URL and Conversions after a week. One network sends most of the visits and few of the buyers, so the promoter moves the budget to the other and watches conversions climb.

  • An Open-Air Festival Watching the Sky

    A festival reads the Historical view months ahead and stocks more ponchos and covered seating. In the final week a severe-weather warning appears for the Saturday, and the team emails ticket holders a new entry time and what to bring.

  • A City Event With Visitors From Abroad

    An organiser sees a fifth of visitors browsing in Spanish and a cluster in a neighbouring city on Visitor Locations. They test a Spanish-language advert and run a small campaign in that city.

  • A Conference Checking Its Booking Journey

    A conference team sees most visitors arrive on desktop browsers from LinkedIn during working hours. They test the booking journey on those browsers and schedule announcements for weekday mornings, when the hourly chart peaks.

  • An Outdoor Theatre Run

    An outdoor theatre opens Performance each morning of the run and reads the chance of rain for that evening. On a bright forecast it sends a last-minute ticket push, and on a wet one it emails ticket holders about cover.

Get this page as a PDF Read it later or share it with your team. We email you a link to the PDF.
What to put in your PDF

We will email you this deck. We may also email you now and then about Ticket Fairy features that can help your events. You can unsubscribe at any time with one click.

Questions About Traffic and Weather Reports

Traffic & weather

Yes. Visits counts every opening of your public event page, your team's included, so a week of checking your own page lifts the figure on a quiet event.

No. Conversions counts visits that reached the order confirmation page, free registrations included. Read it as your event page's hit rate, and use your sales reports for exact order counts.

Visits counts every opening of your event page, including the same person coming back. Unique Visits counts each visitor once in each hour they were on the page, so browsing across two hours counts twice.

Some apps and messaging services pass visitors on with no site attached, so those visits are counted under N/A, with typed addresses. Facebook, Instagram, Google and Yahoo each appear under one name. Only a buyer's referral link or a promoter's link counts as a referral visit; your own tracking links count as direct visits.

No. It shows the language set on the visitor's phone or browser. Visitor Locations shows where a visitor was when they opened the page, from their internet connection, and leaves out visits it cannot place. Take your city, region and country figures from Total by Location.

They count visits to this event's own page only. The charts group and label the days in your event's own time zone.

Your event needs a venue chosen from the search under Venue Location, or an address entered by hand when you publish. The weather shows from about 18 months before your event until two days after it ends. An online event has no venue, so it has no weather.

The current conditions and the forecast appear once your event is about a week away, and the strip covers eight days from today at most. The later days of a long event join the strip as they come into range. Before that, Historical shows what the first day of your event is usually like.

A new forecast is fetched for your venue when the one held is more than three hours old, more than an hour old once your event is four days away, and more than 30 minutes old from 36 hours before it starts until two days after it starts. A warning covers the area around your venue, so read its hours against your own dates.

With an owner, admin, Stats or Limited Stats login you see every figure in the Traffic report. The weather shows on the Performance page for owners, admins, Stats logins and promoters, and a Limited Stats login sees the sales table without it. Your choice of °F or °C stays in your browser for every event you open.

Sell more tickets. Build the crowd that comes back.

Start Selling Tickets Online

Sign up without a credit card and build a test event before you commit. Go on sale in minutes when you are ready.

No monthly subscription required for ticketing
Start selling tickets immediately
Ticketing tools included in the service fee
Get Started Talk to Fai Now

Ask Fai, our AI assistant, about Ticket Fairy’s features, pricing and how it could work for your event.

No credit card required

Book a demo call

See the referral model that drives 20% more ticket sales on average, learn which campaigns sell tickets, answer buyers faster and keep queues moving.

45-Minute Video Call
Pick a Time That Works for You