
Understanding your event reports
Understand who buys tickets to your event
A promoter deciding who to market the next event to starts from who bought the last one. The Demographics report shows your ticket buyers by gender, exact age, age band and profession, and the Devices report shows which devices they ordered on. You can then choose who to aim the next campaign at and where to place it.
Use the Demographics and Devices reports for your event to compare age bands, gender, jobs and employers, see which devices buyers ordered on, and understand what each figure counts.
- For
- Deciding who to market your next event to
- Takes
- 6 minutes
Your Demographics page
Before you start
- You're an owner or an admin on this event, or you have a Stats or Limited Stats login for it. All four can open the report.
- You have sold tickets. Age data appears as soon as buyers provide dates of birth. Gender and profession data can take about 24 hours after the first sales.
-
Gender Breakdown
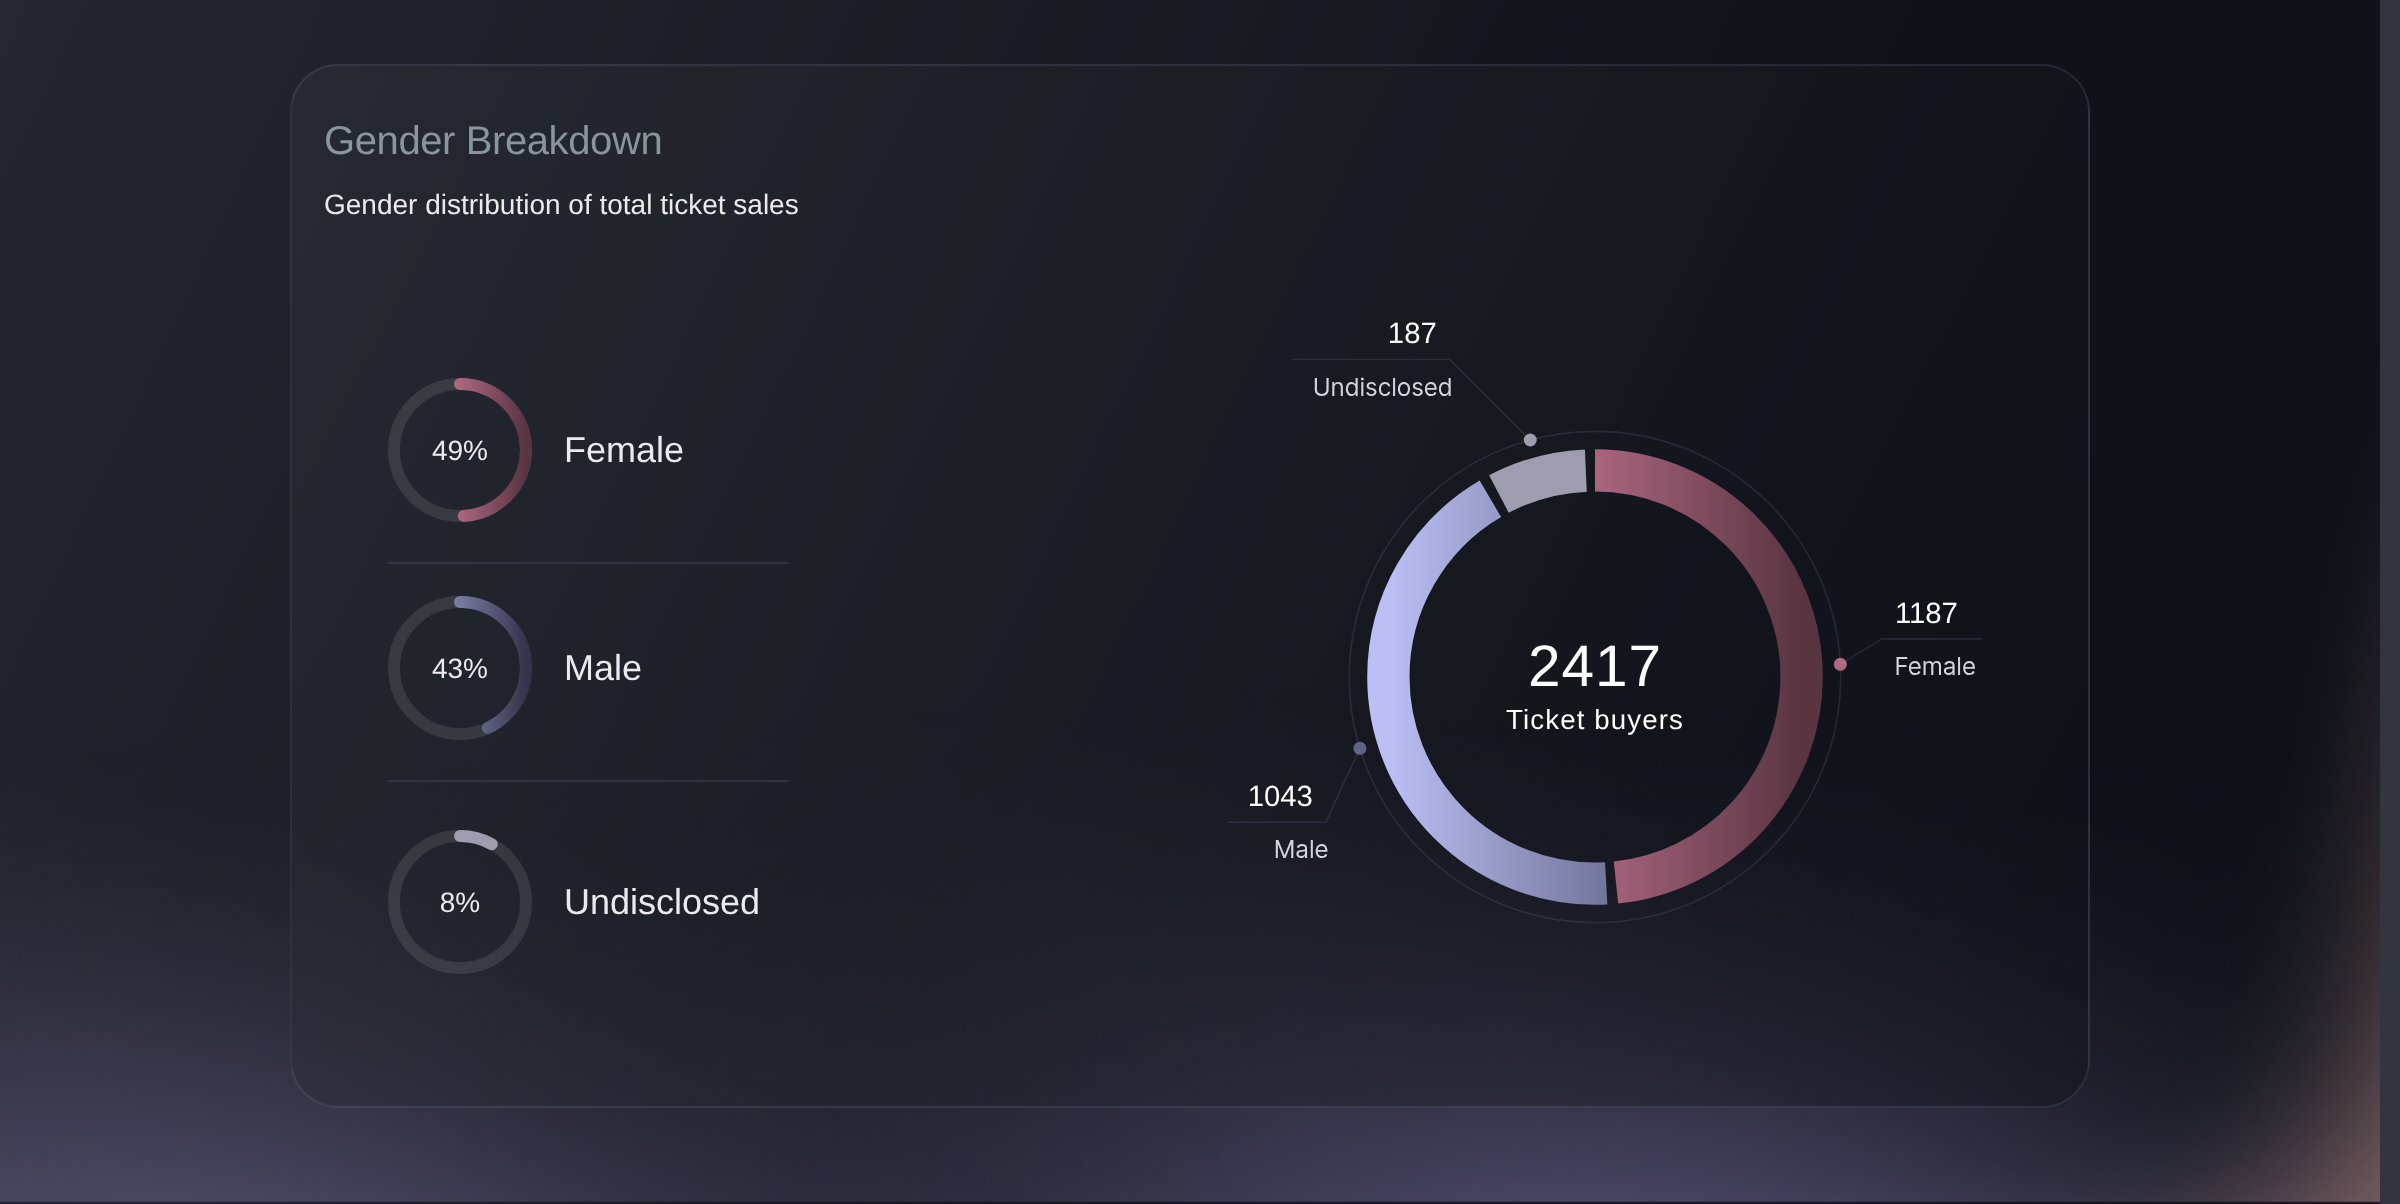
Open your event and go to Demographics. The ring counts ticket buyers, split into Female, Male and Undisclosed, with the same three as a percentage down the left.
Note: Undisclosed is buyers who did not say rather than a gap in your data, so compare the other two as shares of who answered. Where you collect gender at checkout instead, the report shows only Female and Male. A buyer who purchases two ticket types counts twice.
Demographics, Gender Breakdown. -
Age Breakdown
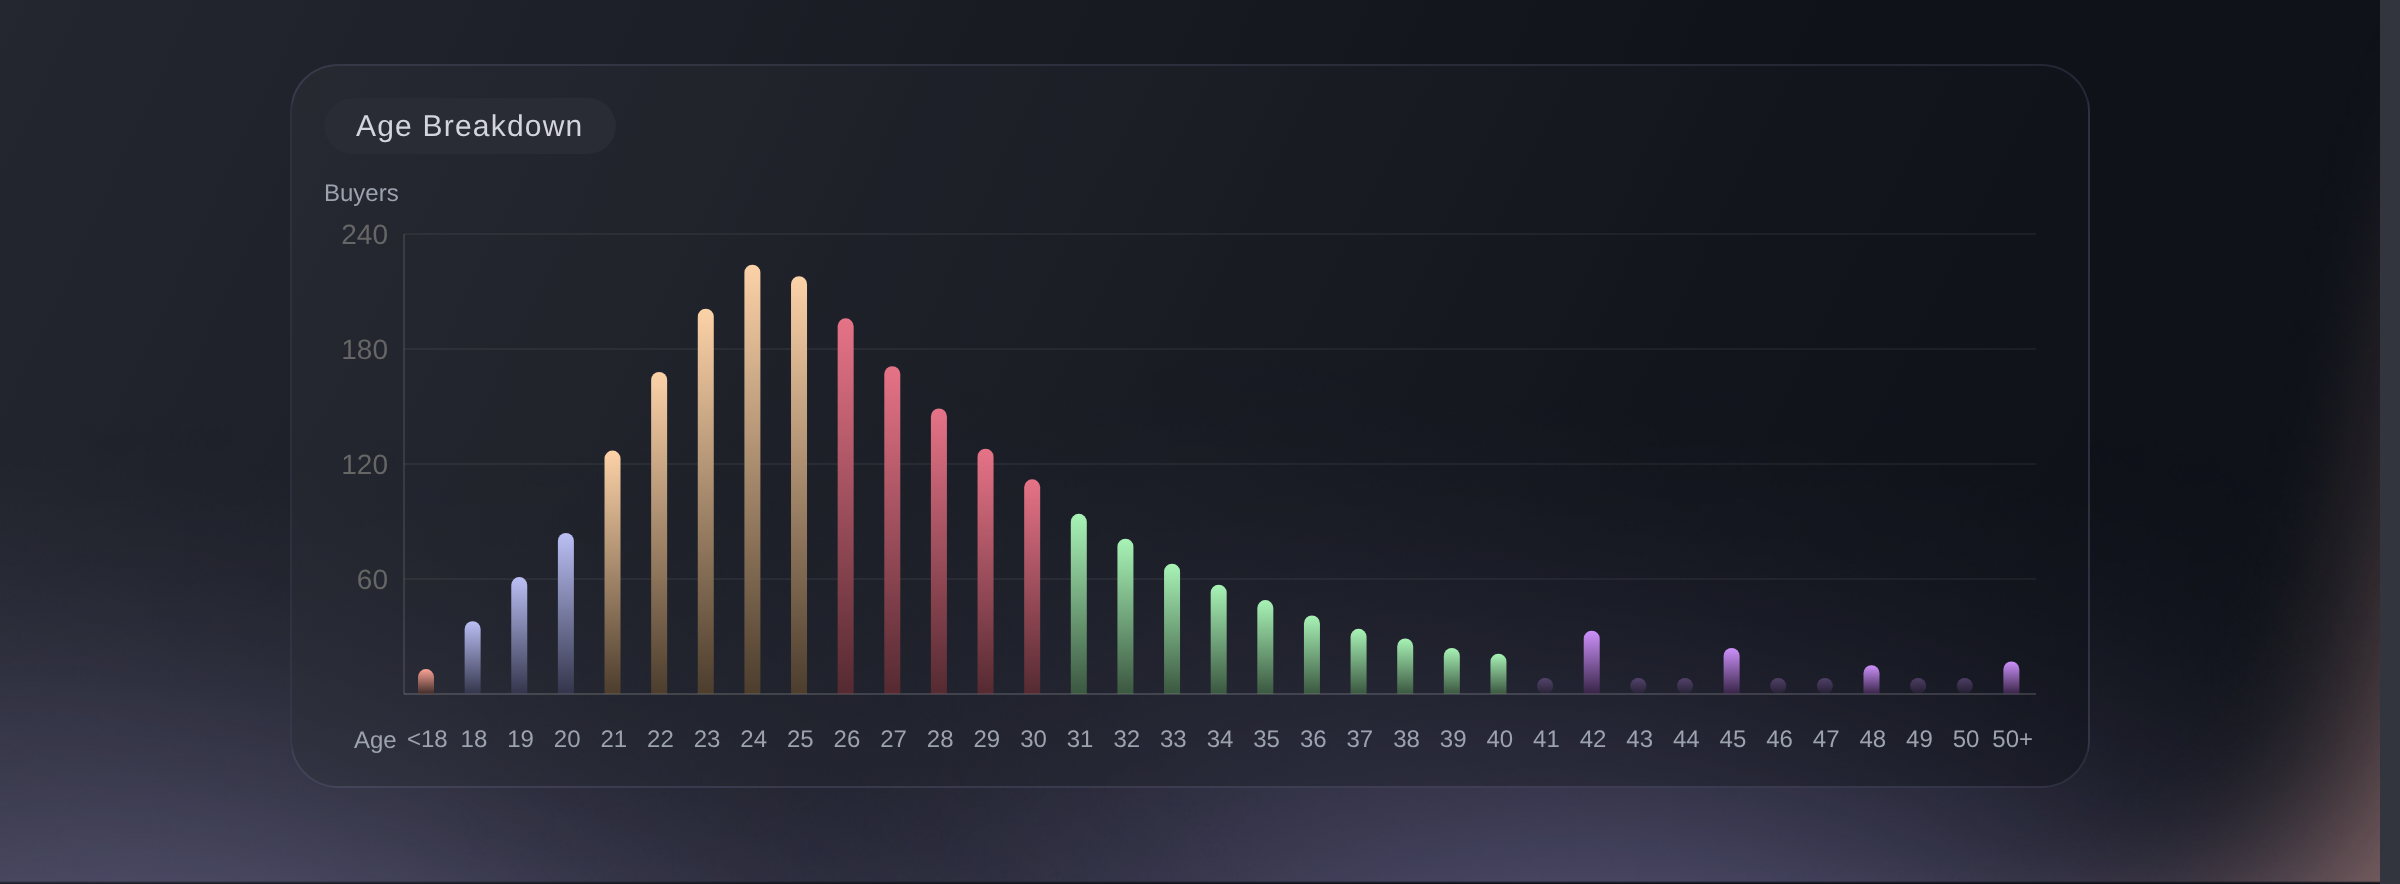
One column per year of age, from your youngest buyer to your oldest. Each column shows how many buyers were that age when they ordered. Hover over a column to see the age and the number of buyers.
Note: Use the exact-age chart to spot separate peaks that broad age bands can hide. Separate peaks may be worth testing as different advertising audiences. Both age sections count ticket lines, so one person buying two ticket types counts twice.
Demographics, Age Breakdown. -
Age Ranges
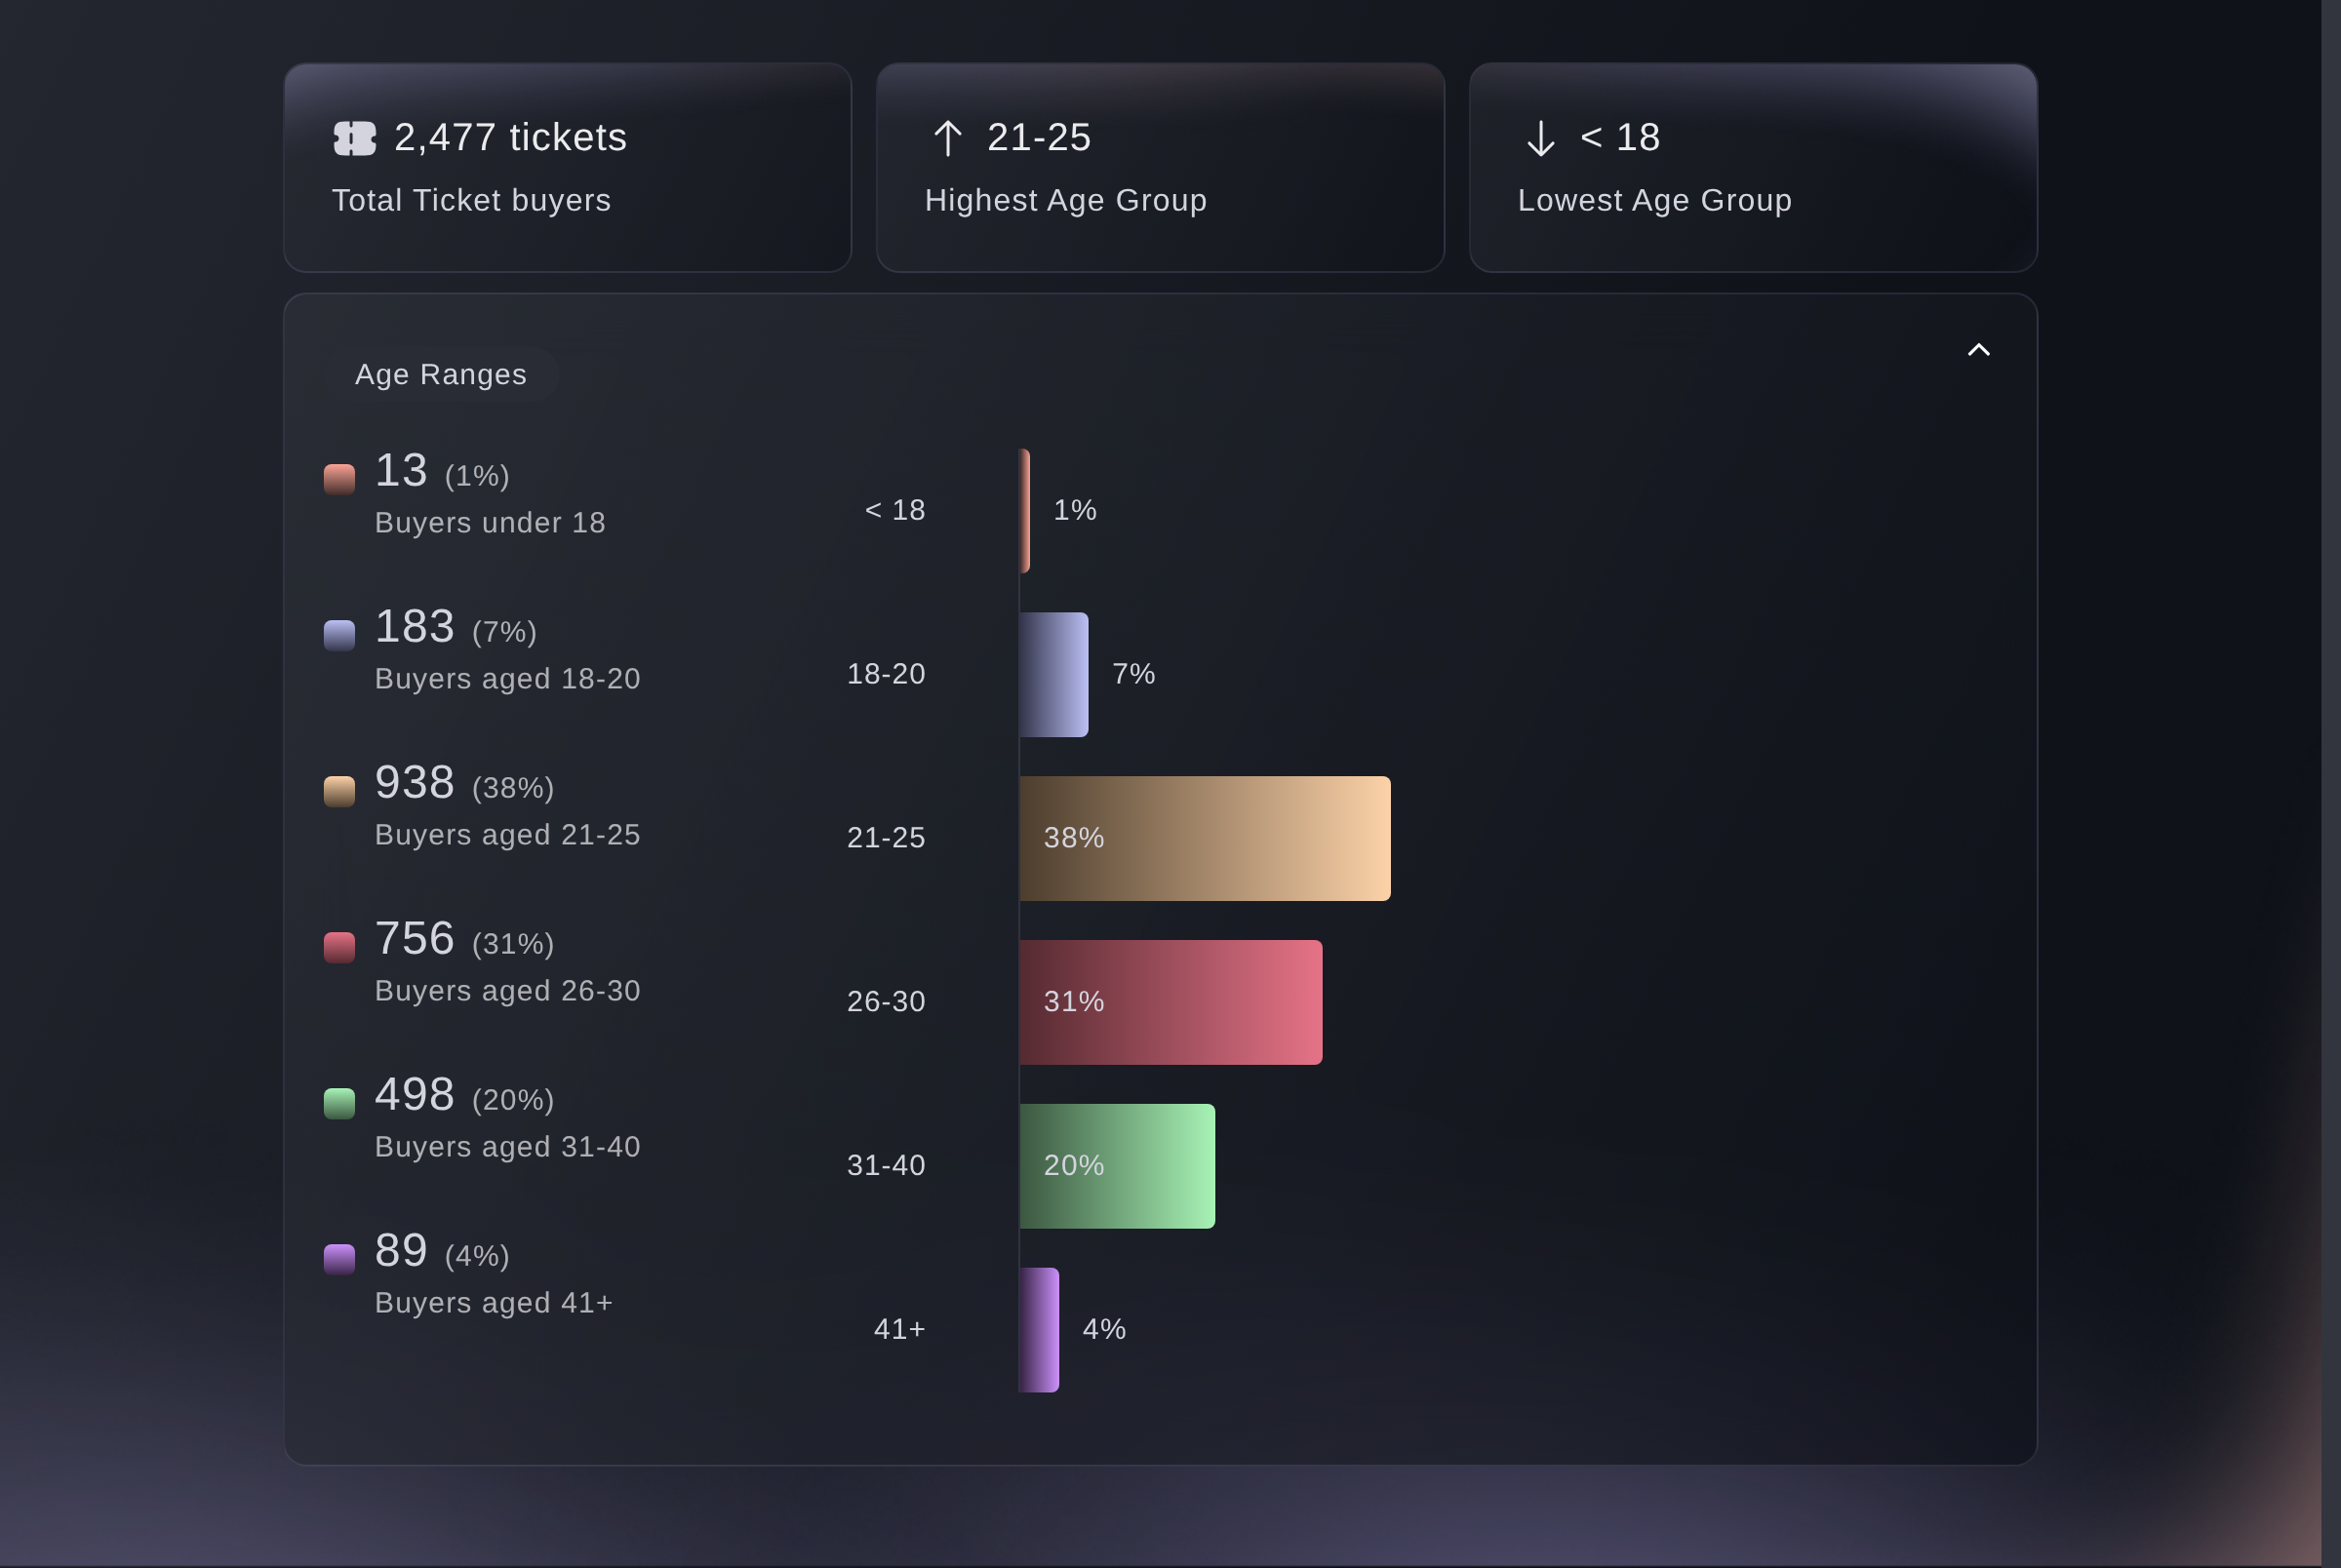
Age Ranges groups the same buyers into six bands and shows the count and share for each. Above the chart, you can see Total Ticket buyers, the Highest Age Group and the Lowest Age Group.
Note: The total here counts buyers who gave a date of birth, so it may be lower than your total ticket sales. Compare the bands with each other rather than against the number of tickets you sold.
Demographics, Age Ranges. -
Professions
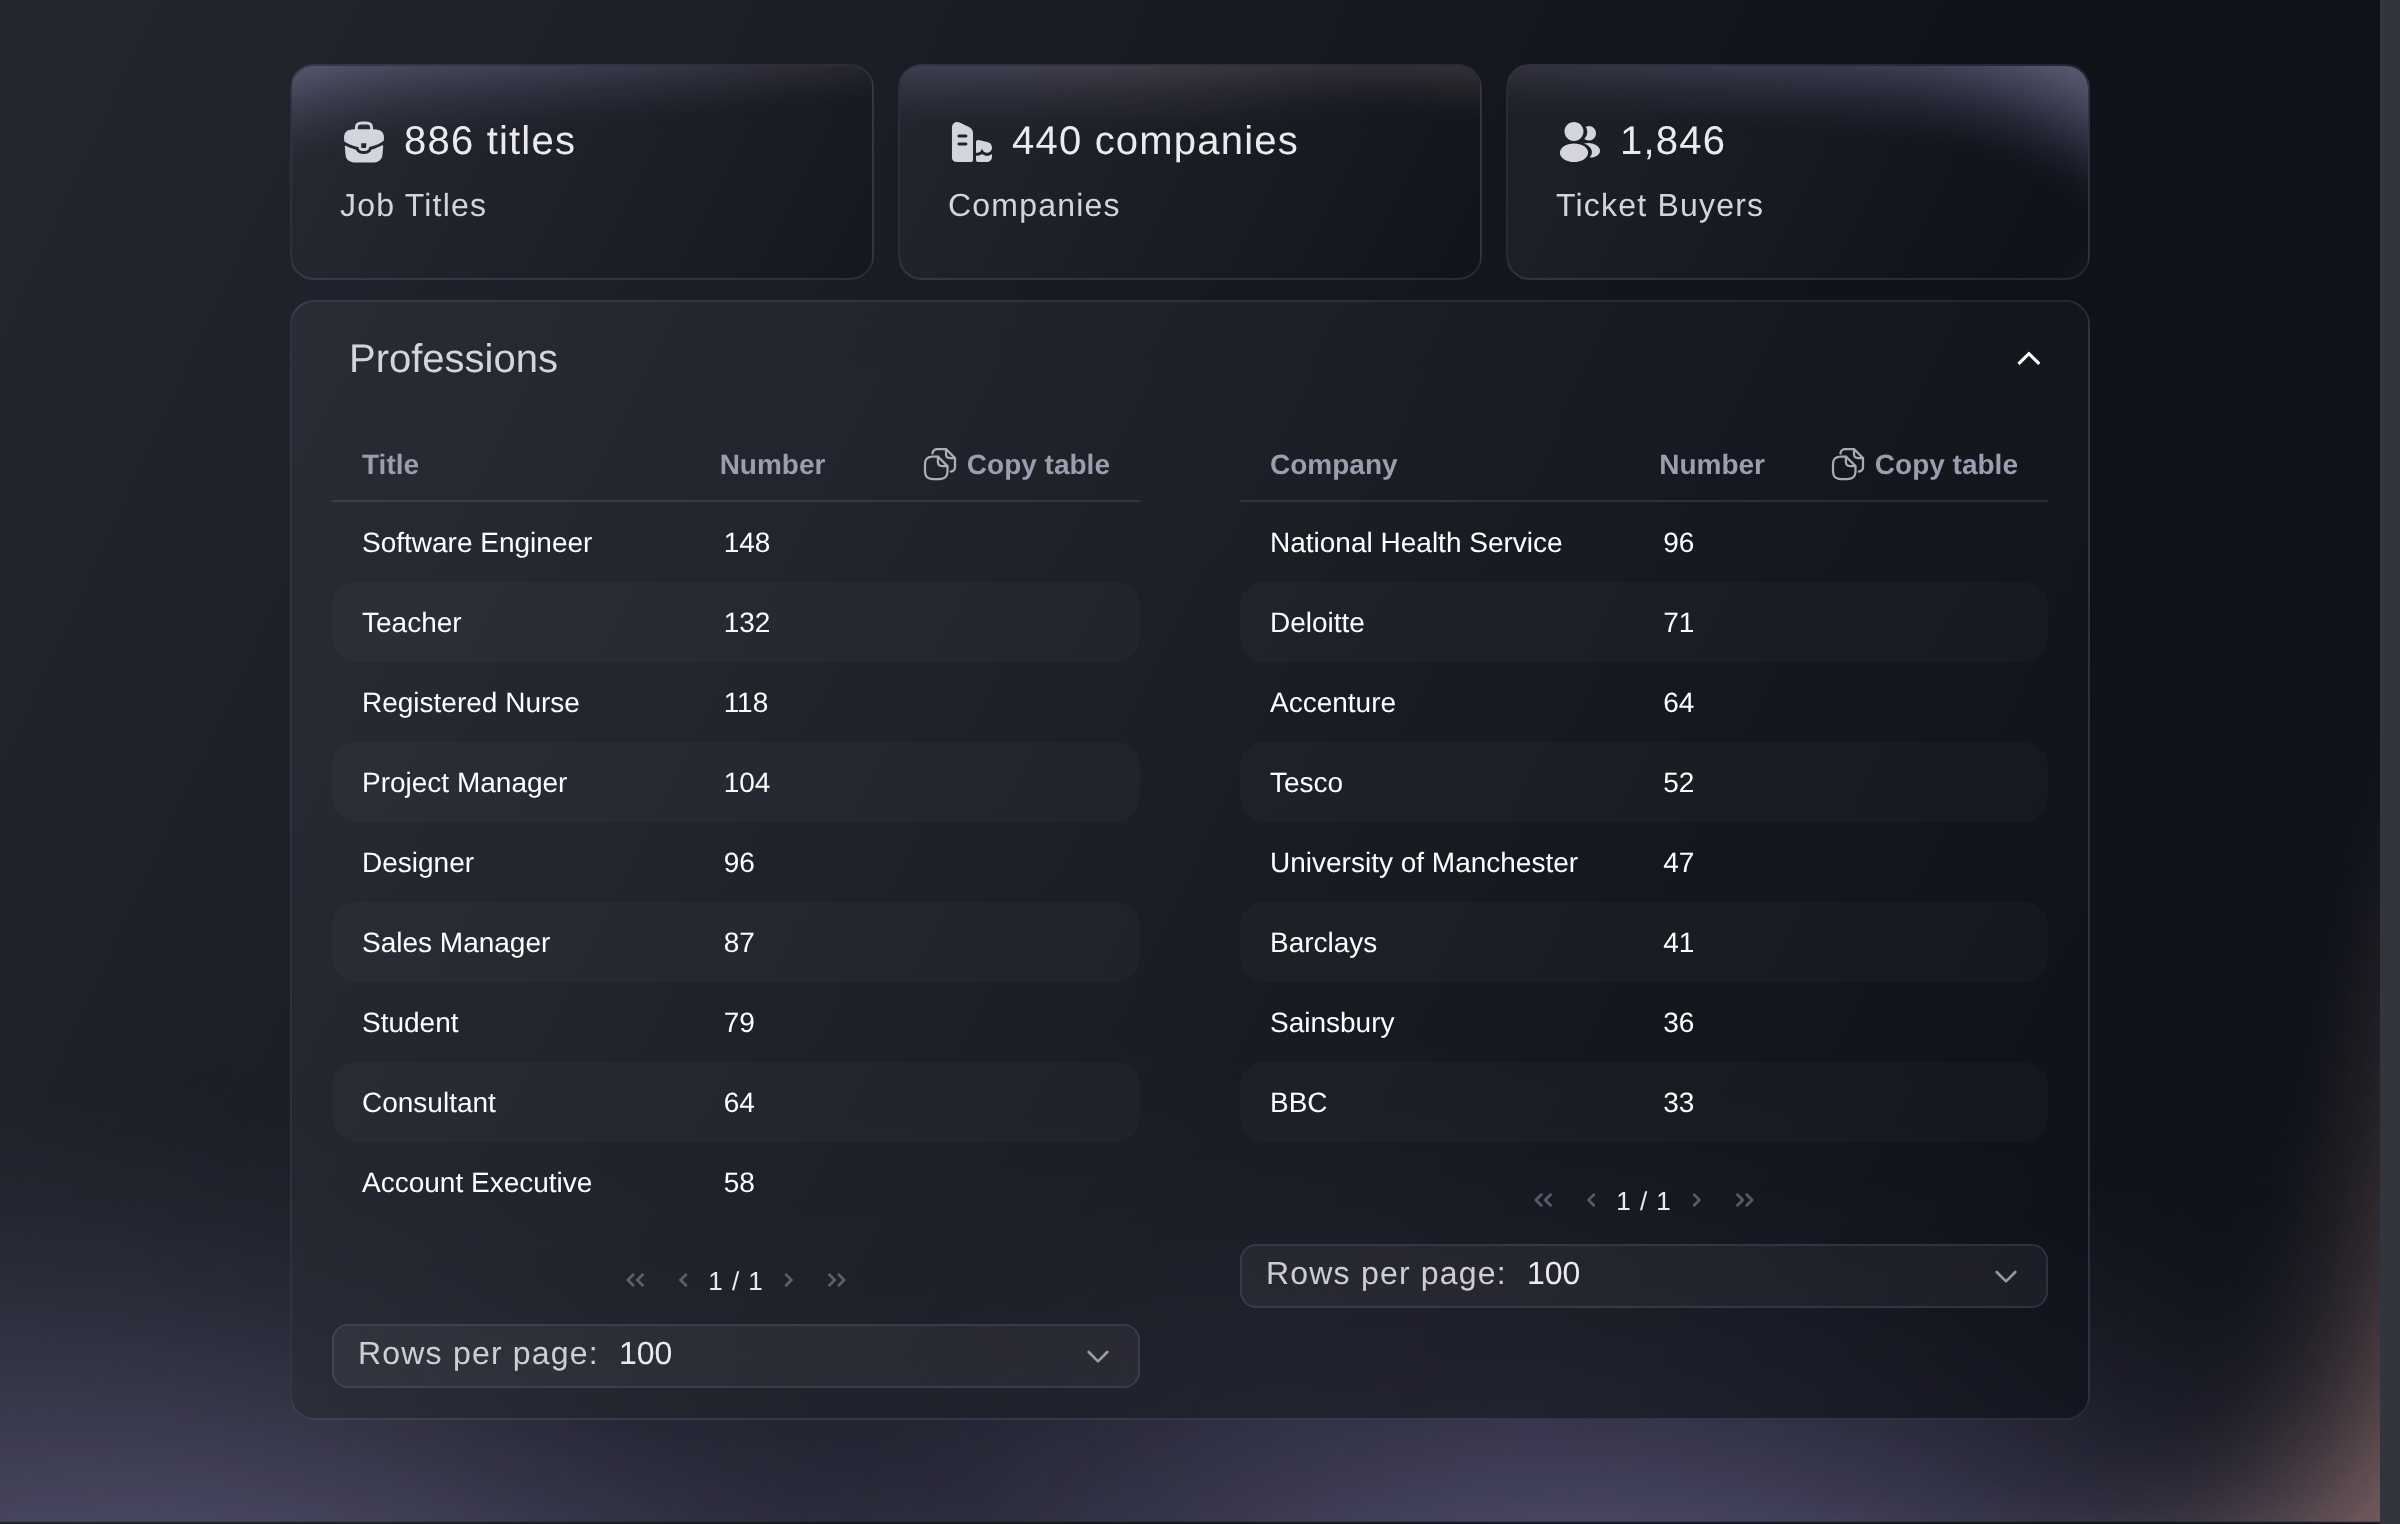
Two tables: job titles on the left and employers on the right, each showing the number of buyers who provided that job title or employer. Copy table puts either one on your clipboard for a spreadsheet.
Note: The three figures above the tables add up the counts in them. Job Titles counts buyers with a job title on file; it is not the number of different titles. The table folds two versions of the same job title into one row.
Demographics, Professions. -
Devices under Demographics
Open Devices, listed under Demographics in the same menu, for the same buyers counted by what they bought on: browser, device type, platform, brand and model. Traffic carries a Devices section of its own, which counts everybody who opened your event page rather than only the people who bought; the guide to seeing how visitors find your event page explains it.
Note: The count is one per order that reached payment, so a buyer who ordered twice appears twice, and tickets your team issued are left out. Rows whose value was not recorded are dropped, so a list can come to less than Total Ticket Buyers. Include refunded and cancelled orders starts on, so the figures cover every completed order and not only the ones you kept the money from. A list that is mostly phones means buyers are finishing your checkout on a phone, so open your own event page on one.
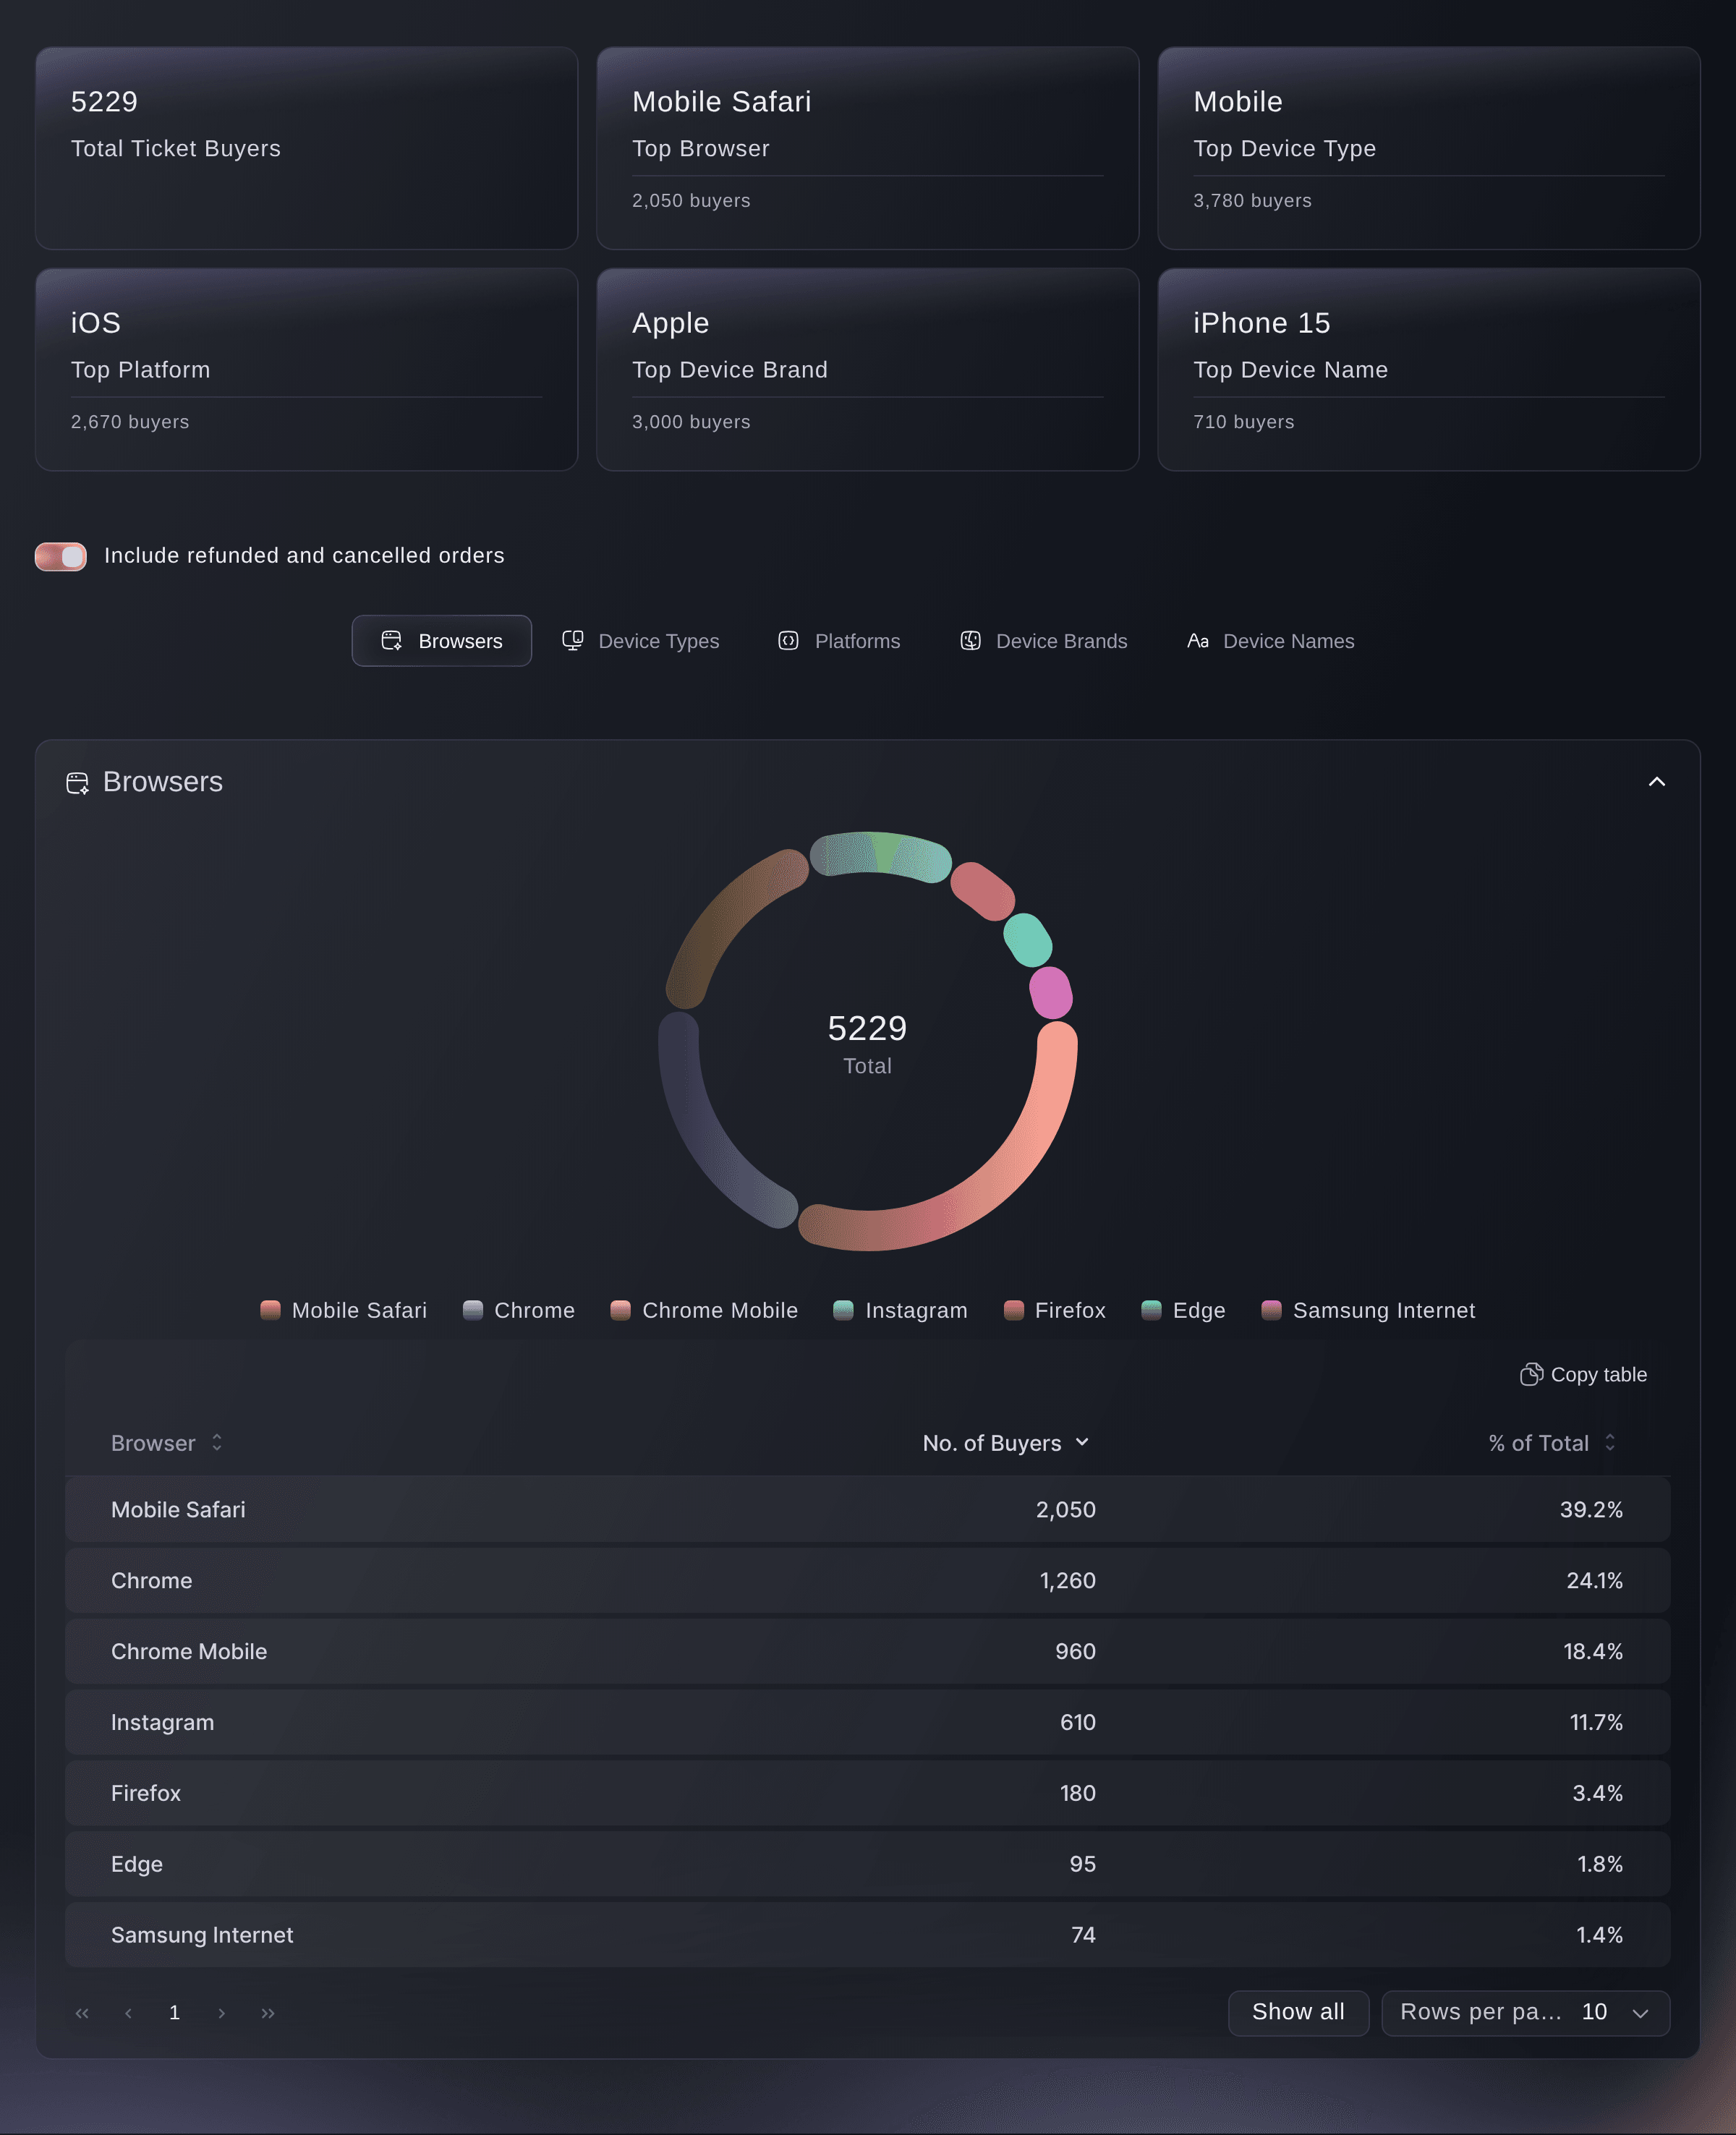
The Devices report.


See these figures for your own event
Create a free account and this report fills as your tickets sell. You see the same figures for your own event from the first sale.
No setup fees. No required monthly ticketing fee. No credit card required.
Or have it done for you
Ask Fai for the age figures and for what buyers bought on. Your own AI assistant reads the age figures through our MCP server. Review the Gender and Professions sections in the dashboard.
In your dashboard, with Fai
Look at the ages of the people who bought for this event and tell me which band bought the most, then tell me what they bought on, counting refunded and cancelled orders too
From your own assistant, over MCP
Connect your assistant to our MCP server and ask it:
Keep --read-only in your MCP configuration. This task only reads data, so your assistant does not need tools that make changes.
Find my event by name, then pull its age demographics and tell me the age band that bought the most and how many buyers gave a date of birth at all
From your terminal
Install the CLI from our CLI page, sign in with ticketfairy auth login, and choose the brand you are working on with ticketfairy brand use <BRAND_ID>. ticketfairy brand list and ticketfairy event list show the IDs the other commands use.
You need an owner, admin, Stats or Limited Stats login. Use the CLI for age figures and for the Devices report, and review Gender and Professions in the dashboard.
The age bands shown in the dashboard
ticketfairy event stats <EVENT_ID> --metric demographics
The same figures, ready for a script
ticketfairy event stats <EVENT_ID> --metric demographics --output json
What buyers bought on, from the Devices report
ticketfairy event stats <EVENT_ID> --metric devices
Let Fai do it for you
Fai works inside your Ticket Fairy dashboard. Create your account, open Fai and paste the prompt above.
No setup fees. No required monthly ticketing fee. No credit card required.
Questions you might have
- Why are my demographics empty when I have sold tickets?
- Age data appears as soon as a buyer provides a date of birth. Gender appears from checkout when you collect it there. Otherwise, Gender and Professions normally appear within 24 hours of your first sales. Until then, the report says
This report is not available yet. Please try again in 24 hours
. - How do you calculate a buyer's age?
- We calculate their age on the day they ordered, using the date of birth on their account, so each buyer counts at the age they were when they bought. Both age sections leave out buyers who did not provide a date of birth.
- Why don't the demographic totals match each other?
- Each section uses the details available for that buyer. Age needs a date of birth, while Gender and Professions come from a separate audience match that runs after the first sales, so you should not expect the three totals to match.
- Do the demographics include free tickets and guest list?
- Yes. A completed free or guest-list order counts when the buyer has provided a date of birth, so a comp counts like any other order. An unfinished payment plan does not count until its final instalment clears.
- Can I get this out into a spreadsheet?
- Copy table on either Professions table puts it on your clipboard, ready to paste. Ask Fai for the age figures or a plain-language summary of the gender split.
Still have a question?
Book a demo and we will answer it on a call, on your kind of event. Or create your account and see it for yourself.
No setup fees. No required monthly ticketing fee. No credit card required.
Related guides
Do this on your own event
Create your account, build your event and follow the steps in your own dashboard. You do not need to book a sales call.