
Understanding your event reports
Understand your event's referral results
A referral link turns a buyer into a seller. The Influencers report puts sharing, clicks, referred revenue and rebates side by side, so a promoter running a referral push sees whether the rewards are paying for themselves, which buyers bring in the most friends, and what to change before the next event.
Use the Influencers report to see how much buyers shared your event, how many clicks those shares brought, which referral links led to sales and what you owe in rewards.
- For
- Running a referral push for an event
- Takes
- 6 minutes
Your Influencers page
Before you start
- You're an owner or an admin on this event, or you have a Stats or Limited Stats login for it. All four see the same sections. On a Limited Stats login the money columns are hidden.
- At least one buyer has shared your event. A buyer gets a referral link of their own in a referral email after they buy, unless you have turned referrals off for the event or that ticket type. Until a buyer orders through one, the referred revenue and the rebates stay at zero, while your total revenue counts every sale, referred or not. On a free event the money figures stay at zero however much sharing happens, because they are built from ticket prices, while the share rate, the clicks and the referred ticket counts fill in as usual.
-
Referral Network Analysis
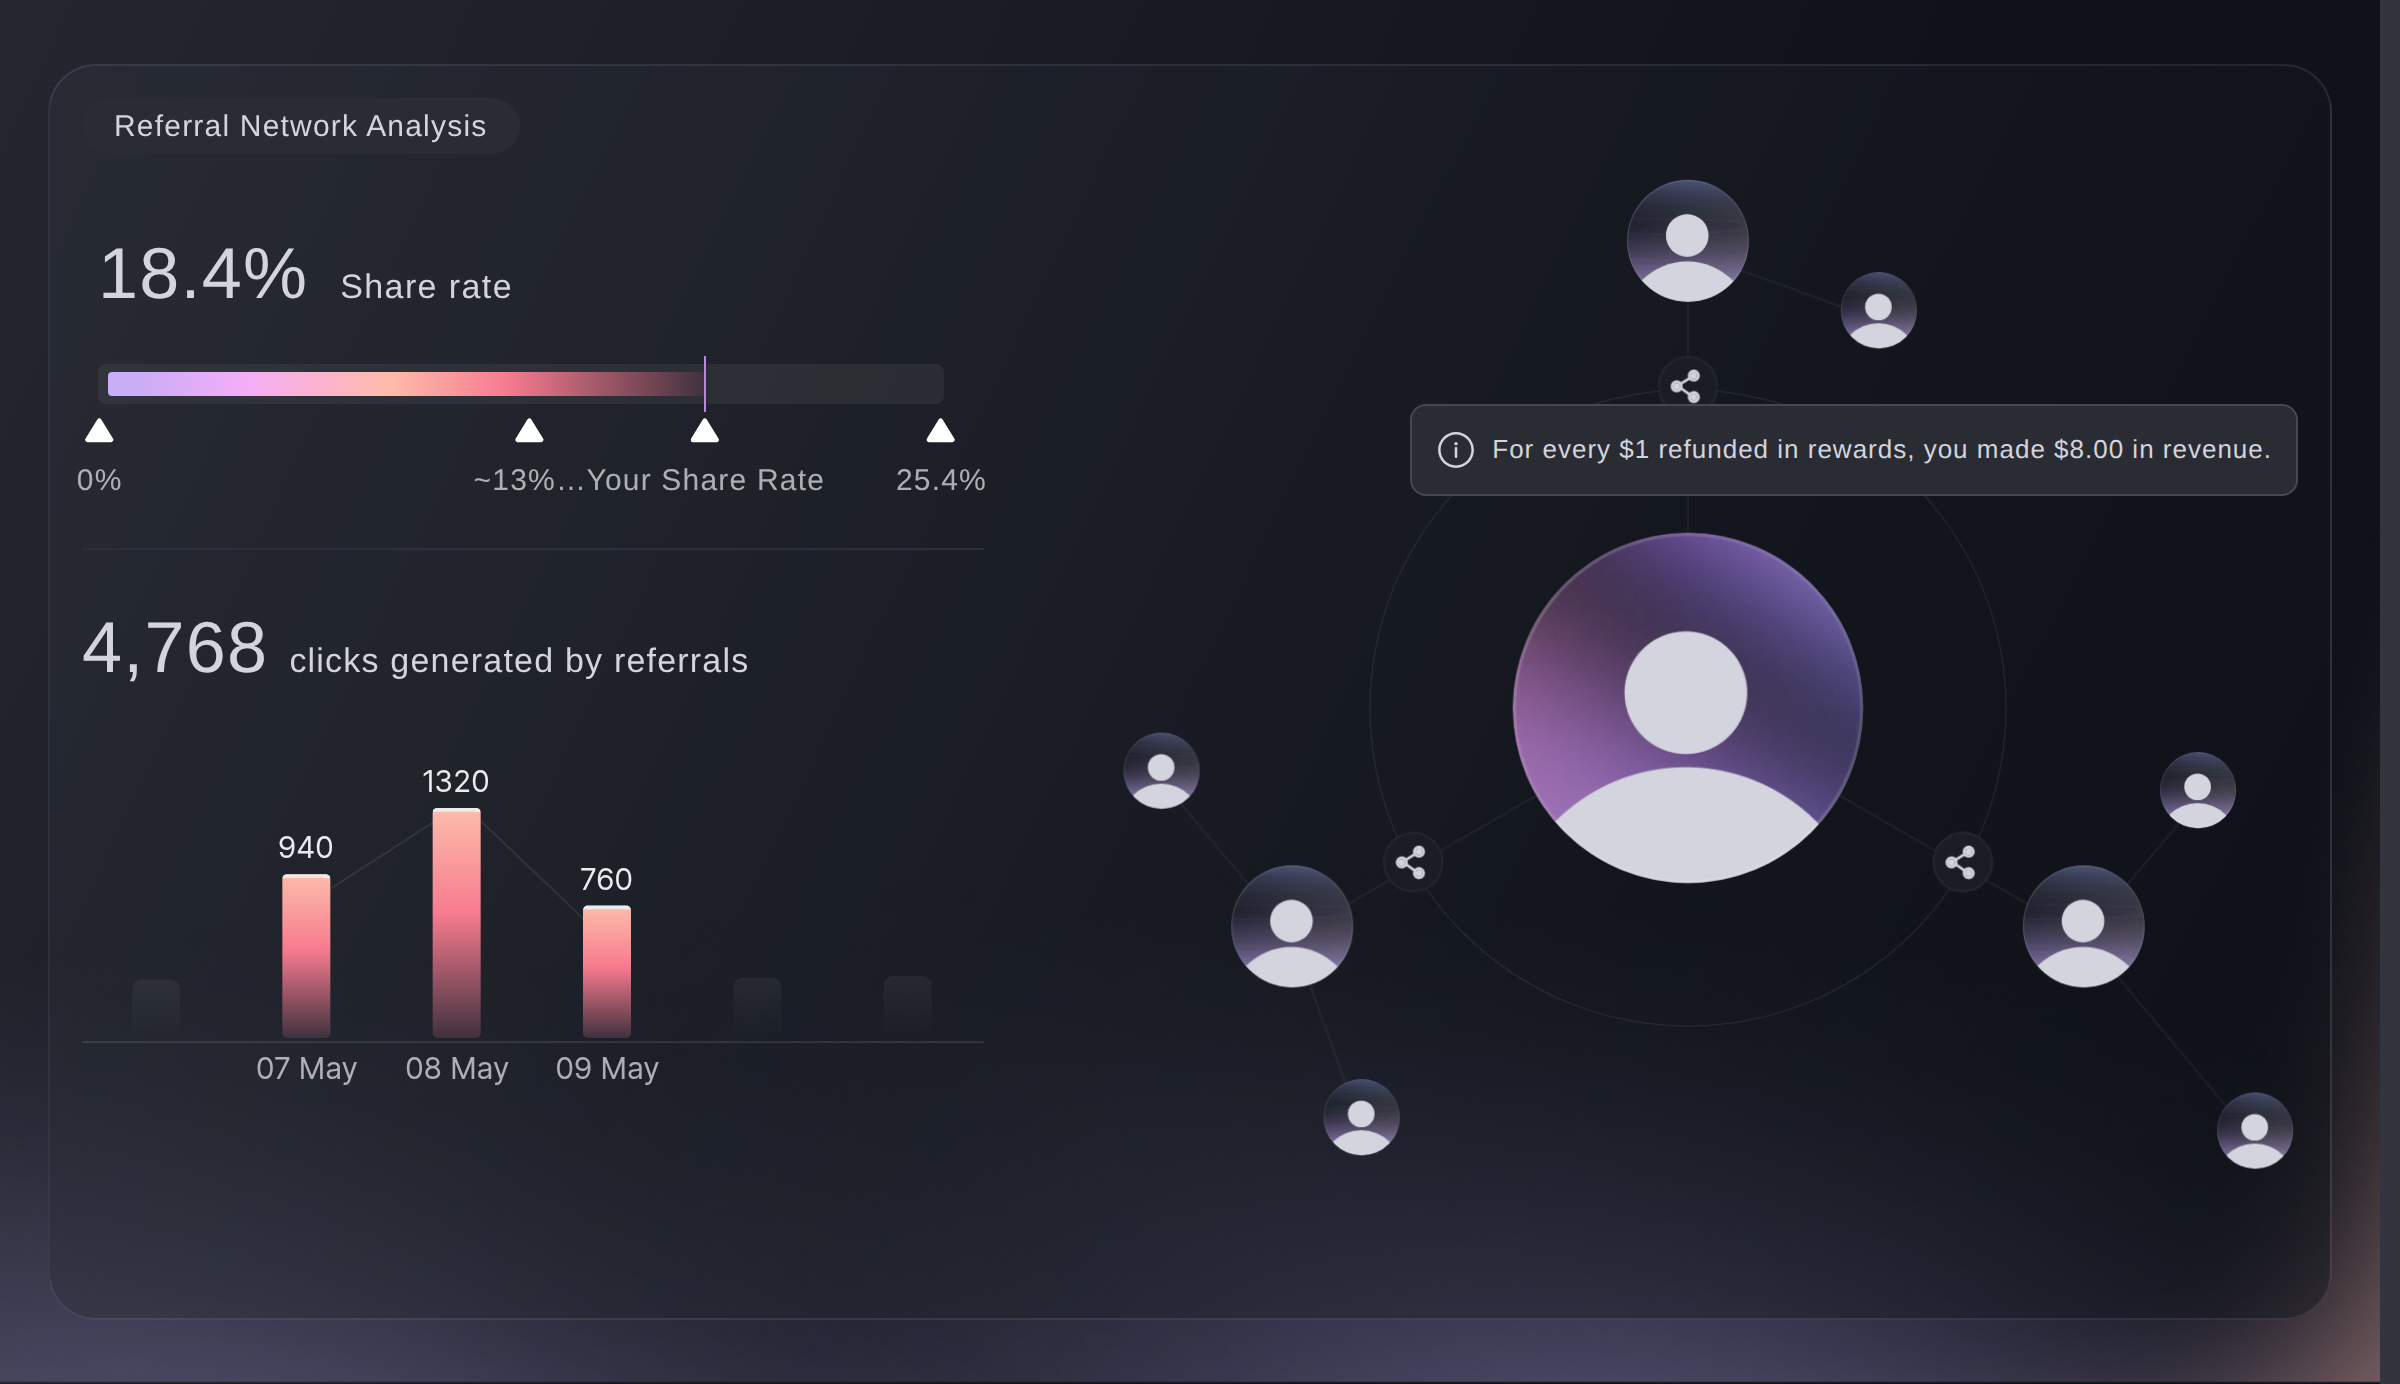
Open your event and go to Influencers. Your share rate sits at the top, as the percentage of buyers who shared your event, then the total clicks those shares brought, then the same clicks by day.
Note: Look at when the clicks arrive, not only how many there are. Clicks bunched around your on-sale and nothing after it means buyers shared once and stopped, which is when a reminder to share is worth sending. The total and chart exclude clicks from your event team, although the table below includes them.
Influencers, Referral Network Analysis. -
Share of Total Revenue
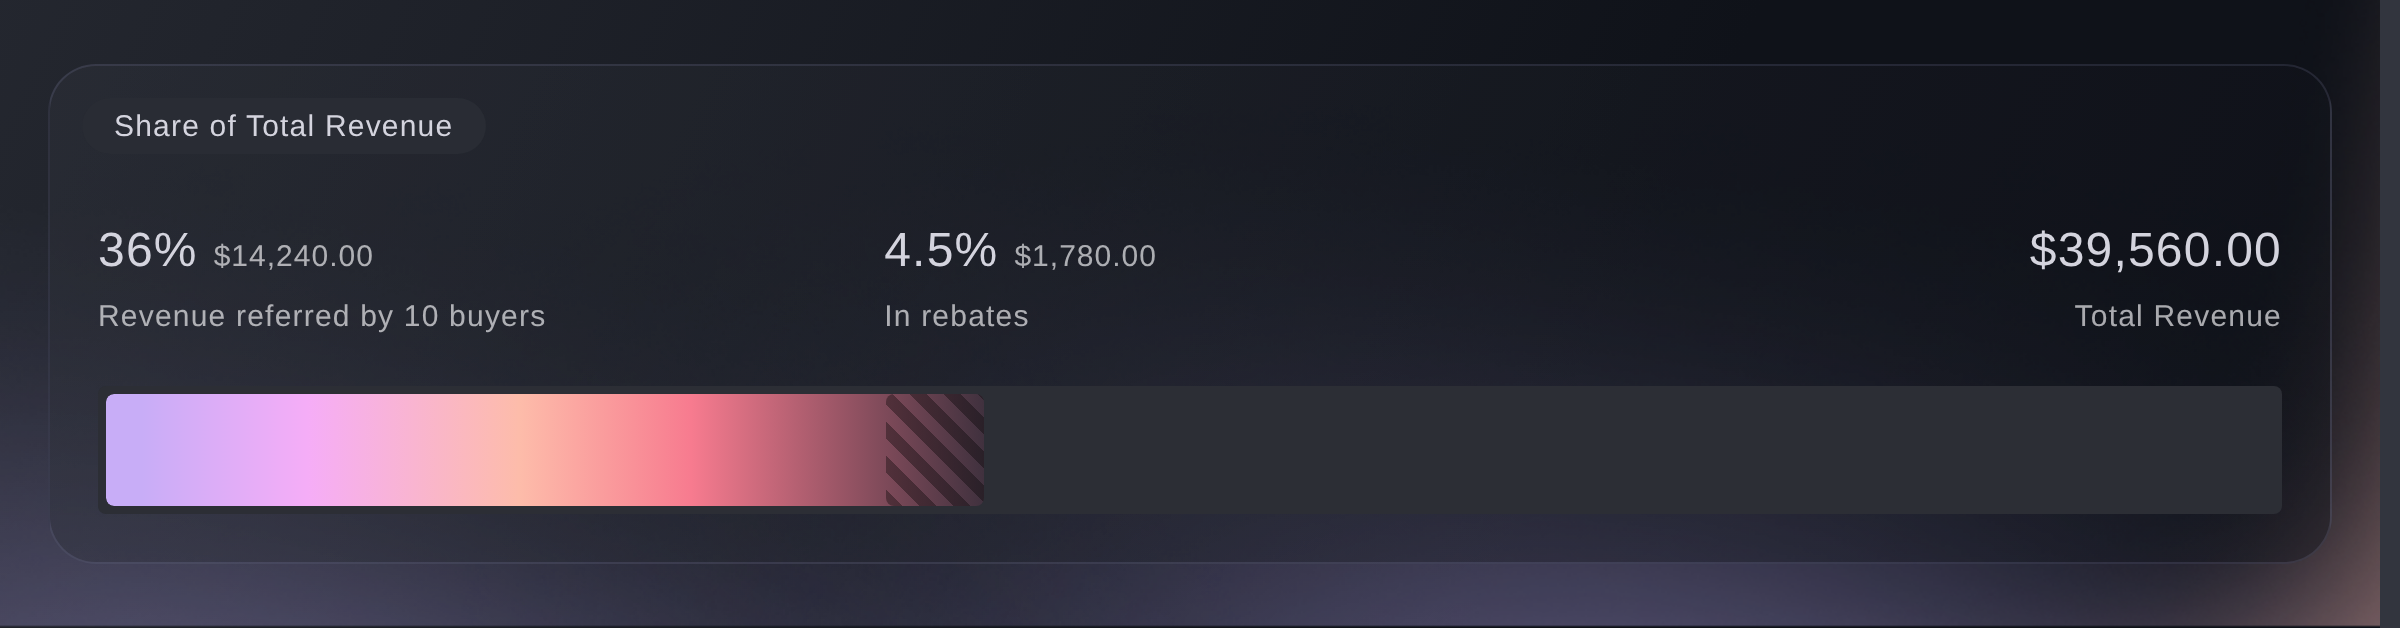
The full bar shows all ticket revenue. The other two figures show the revenue that referrers brought in and the rebates you owe them.
Note: Compare these figures before you increase a reward, because they put the rebate next to the sales it brought in rather than on its own.
Influencers, Share of Total Revenue. -
Revenue referred by buyers
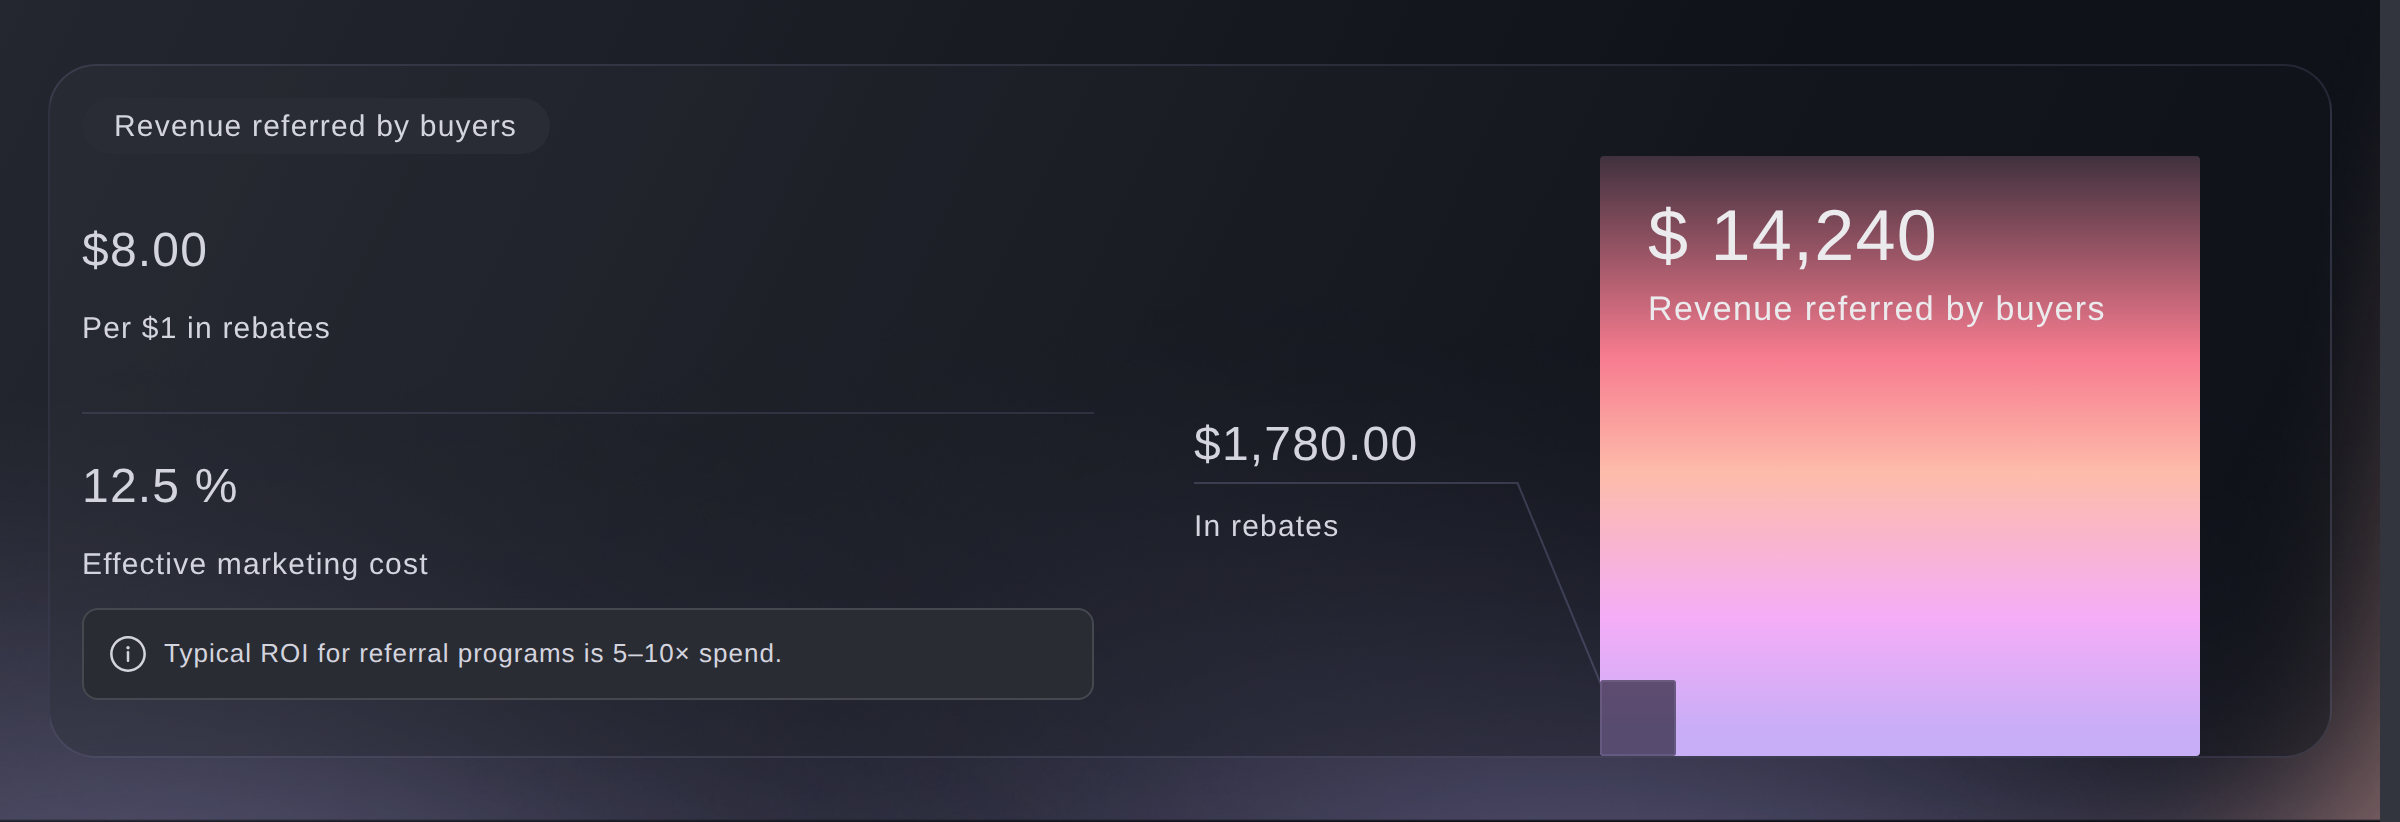
Per $1 in rebates divides referred revenue by the rebates owed. Effective marketing cost shows those rebates as a percentage of referred revenue.
Note: Typical referral programmes return five to ten times what they cost, and a marker shows that band beside your figure. A figure below the band means the reward is generous for what it brings in; a figure well above it means you can afford to offer more.
Influencers, Revenue referred by buyers. -
Reward Targets
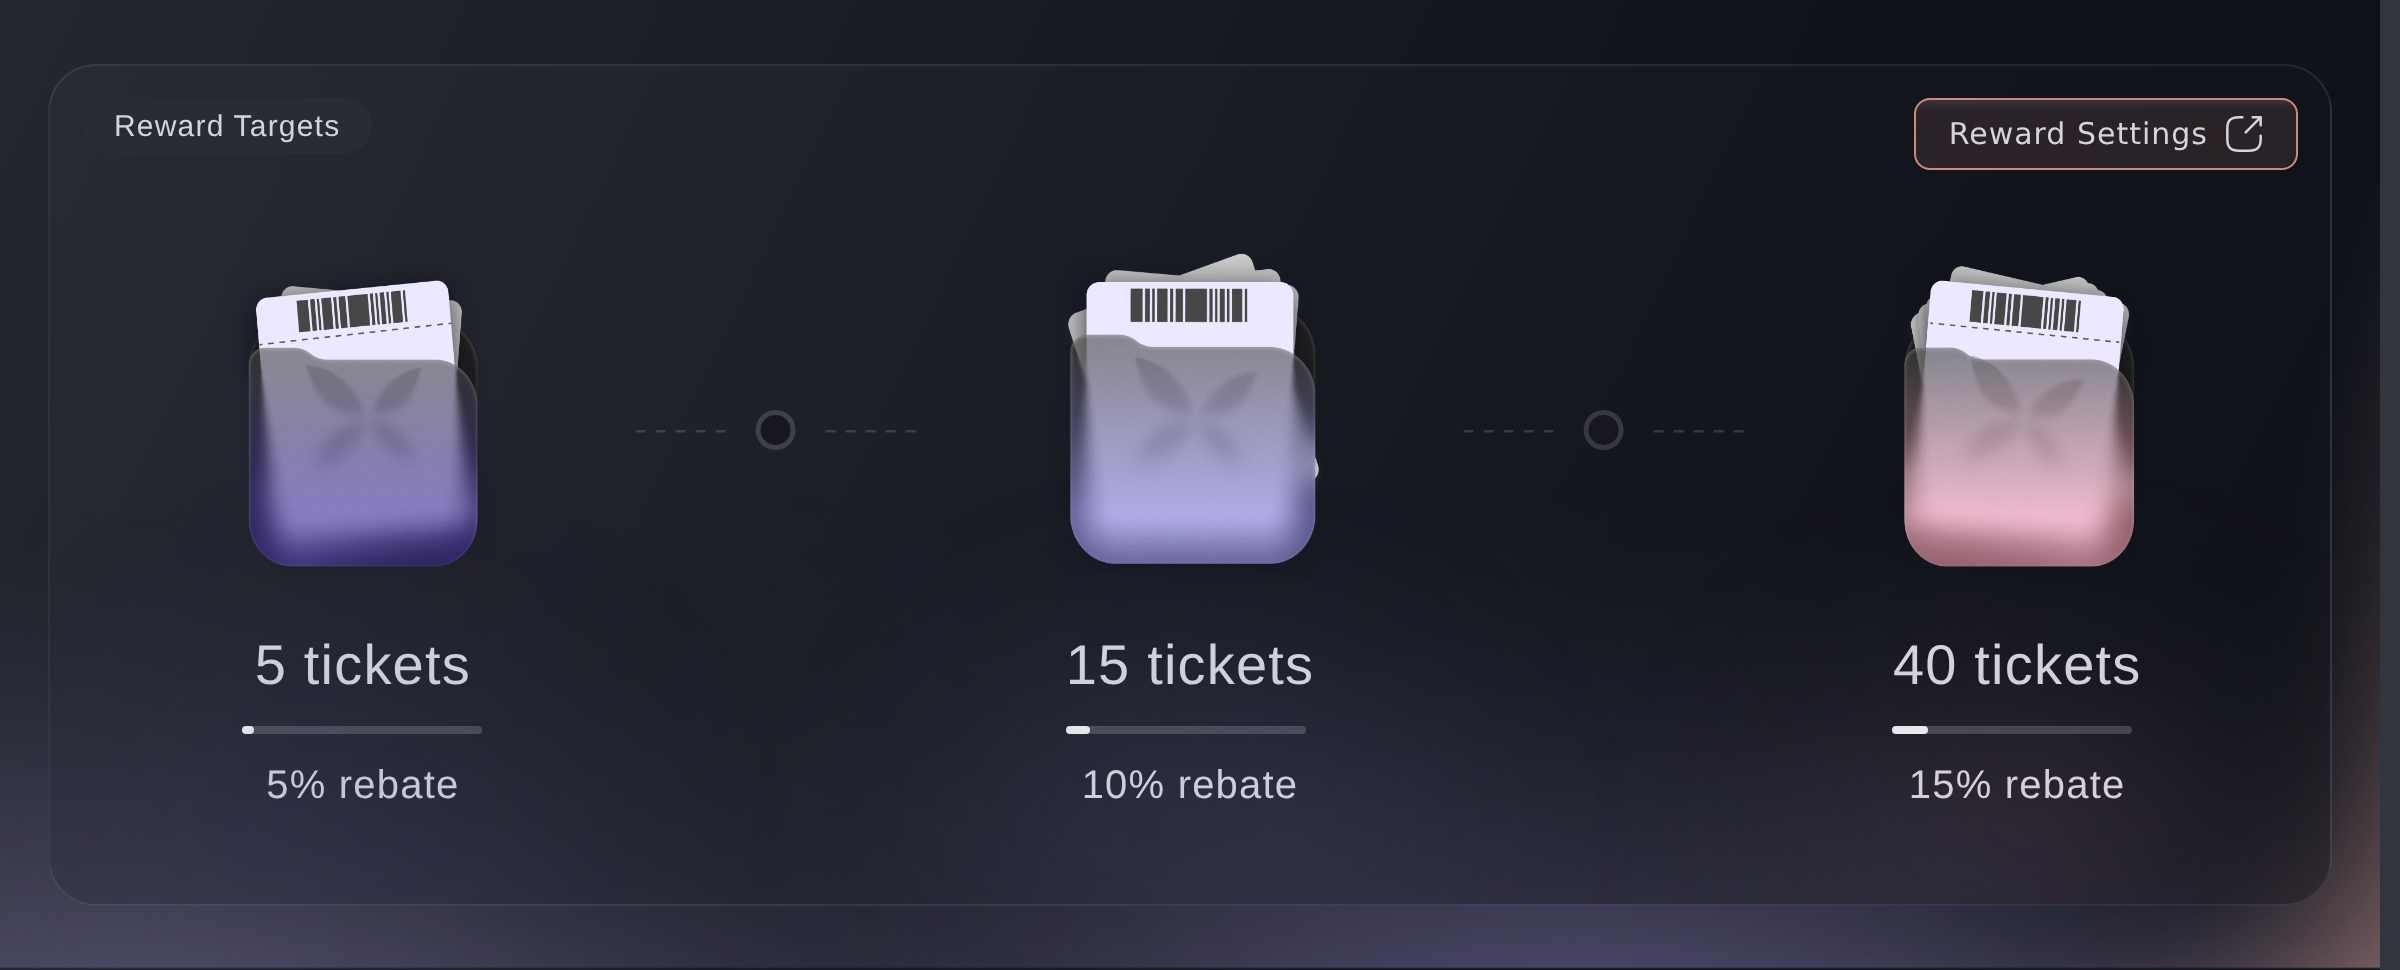
The tiers you set: how many sales a referrer makes to move up a step, and what percentage they earn once they are on it. A newly created event starts at 10% after 2 referred sales, 30% after 5 and 100% after 8.
Note: Compare the steps with the referrer table. If no buyers have reached a tier, they may need more time or the sales target may be too high. Review it near the end of the on-sale rather than on the first day.
Influencers, Reward Targets. -
Sales referred by buyers
The horizontal axis shows the number of tickets referred. The height of each bar shows how many buyers referred that many tickets.
Note: A tall bar at the left means lots of buyers brought a friend or two. A lone bar far out on the right is one buyer referring far more than the rest. Compare the chart with your total ticket sales, then use the table below to find unusually strong referrers before your next on-sale.
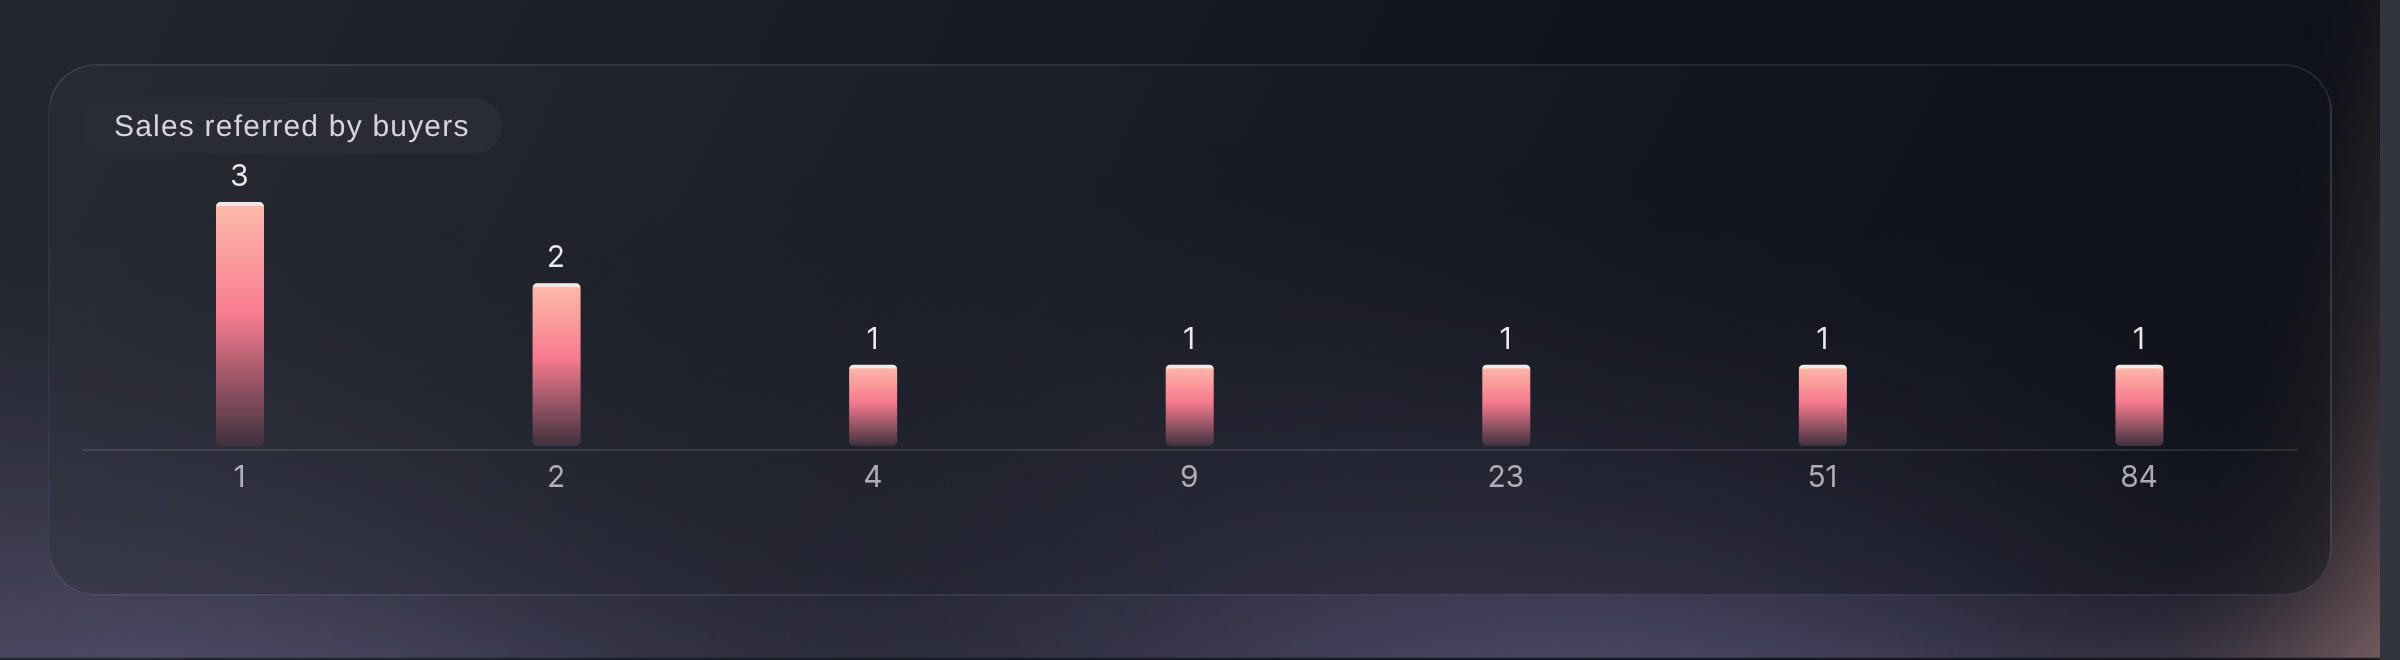
Influencers, Sales referred by buyers. -
Tickets referred by customers
The table shows one referrer per row, including their referred ticket sales, link clicks, referred revenue excluding fees, original purchase price, and the total reward they earned at the tier they reached.
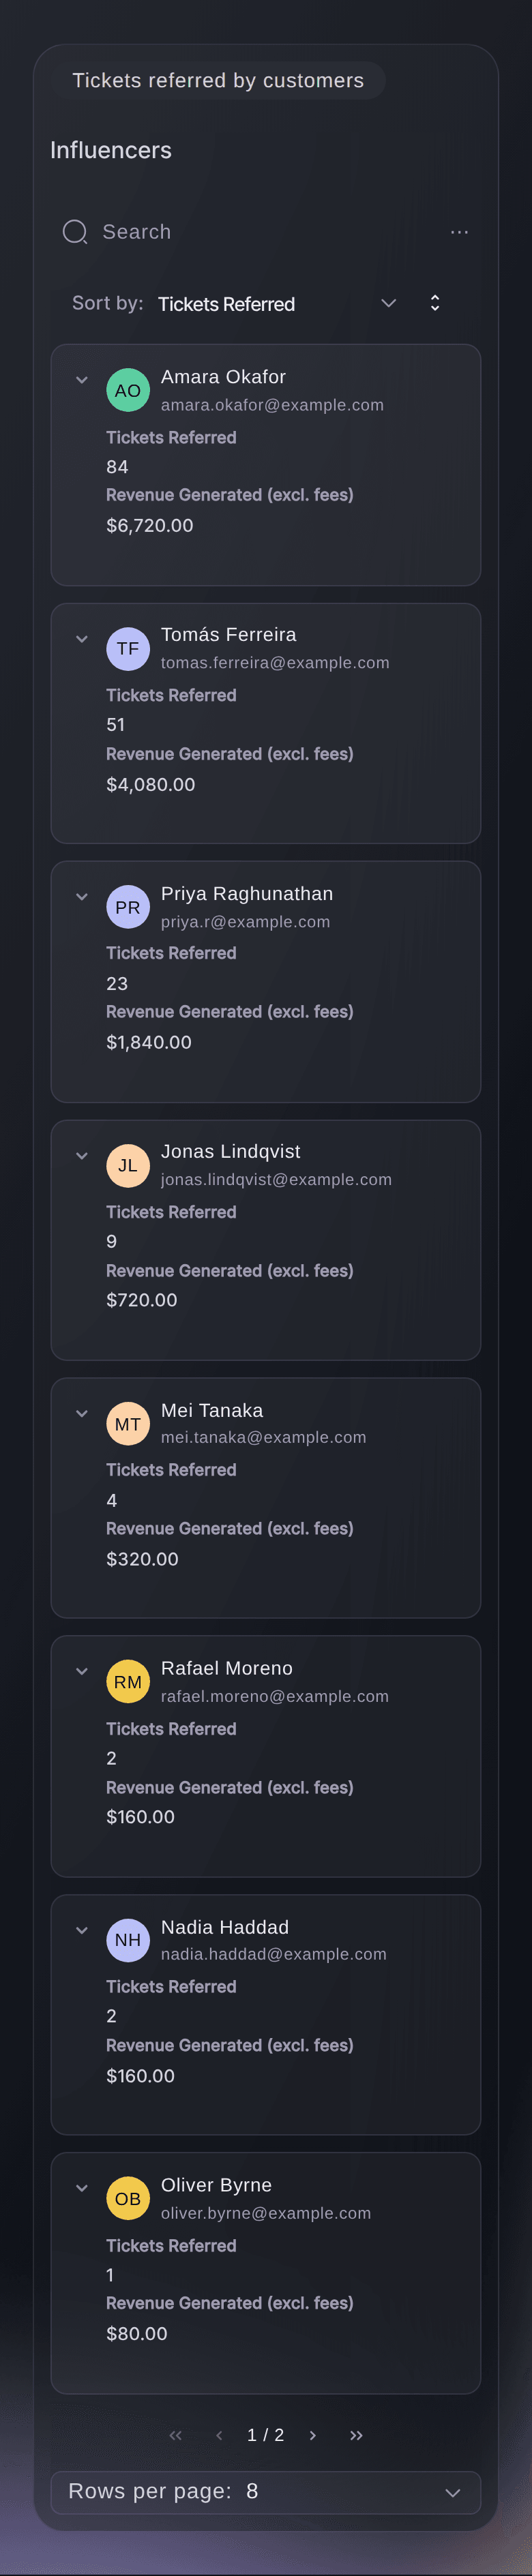
Note: The reward figure is the total earned across this event and any events linked to it for referrals. It is based on the price of that buyer's own ticket and the tier they reached. On a wide page, select a column heading to sort the table. On a small page, use Sort by, select the field and choose ascending or descending. The compact rows keep referred tickets and revenue visible; expand one for the remaining figures. Compare link clicks against tickets referred to find a referrer whose audience is looking but not buying.
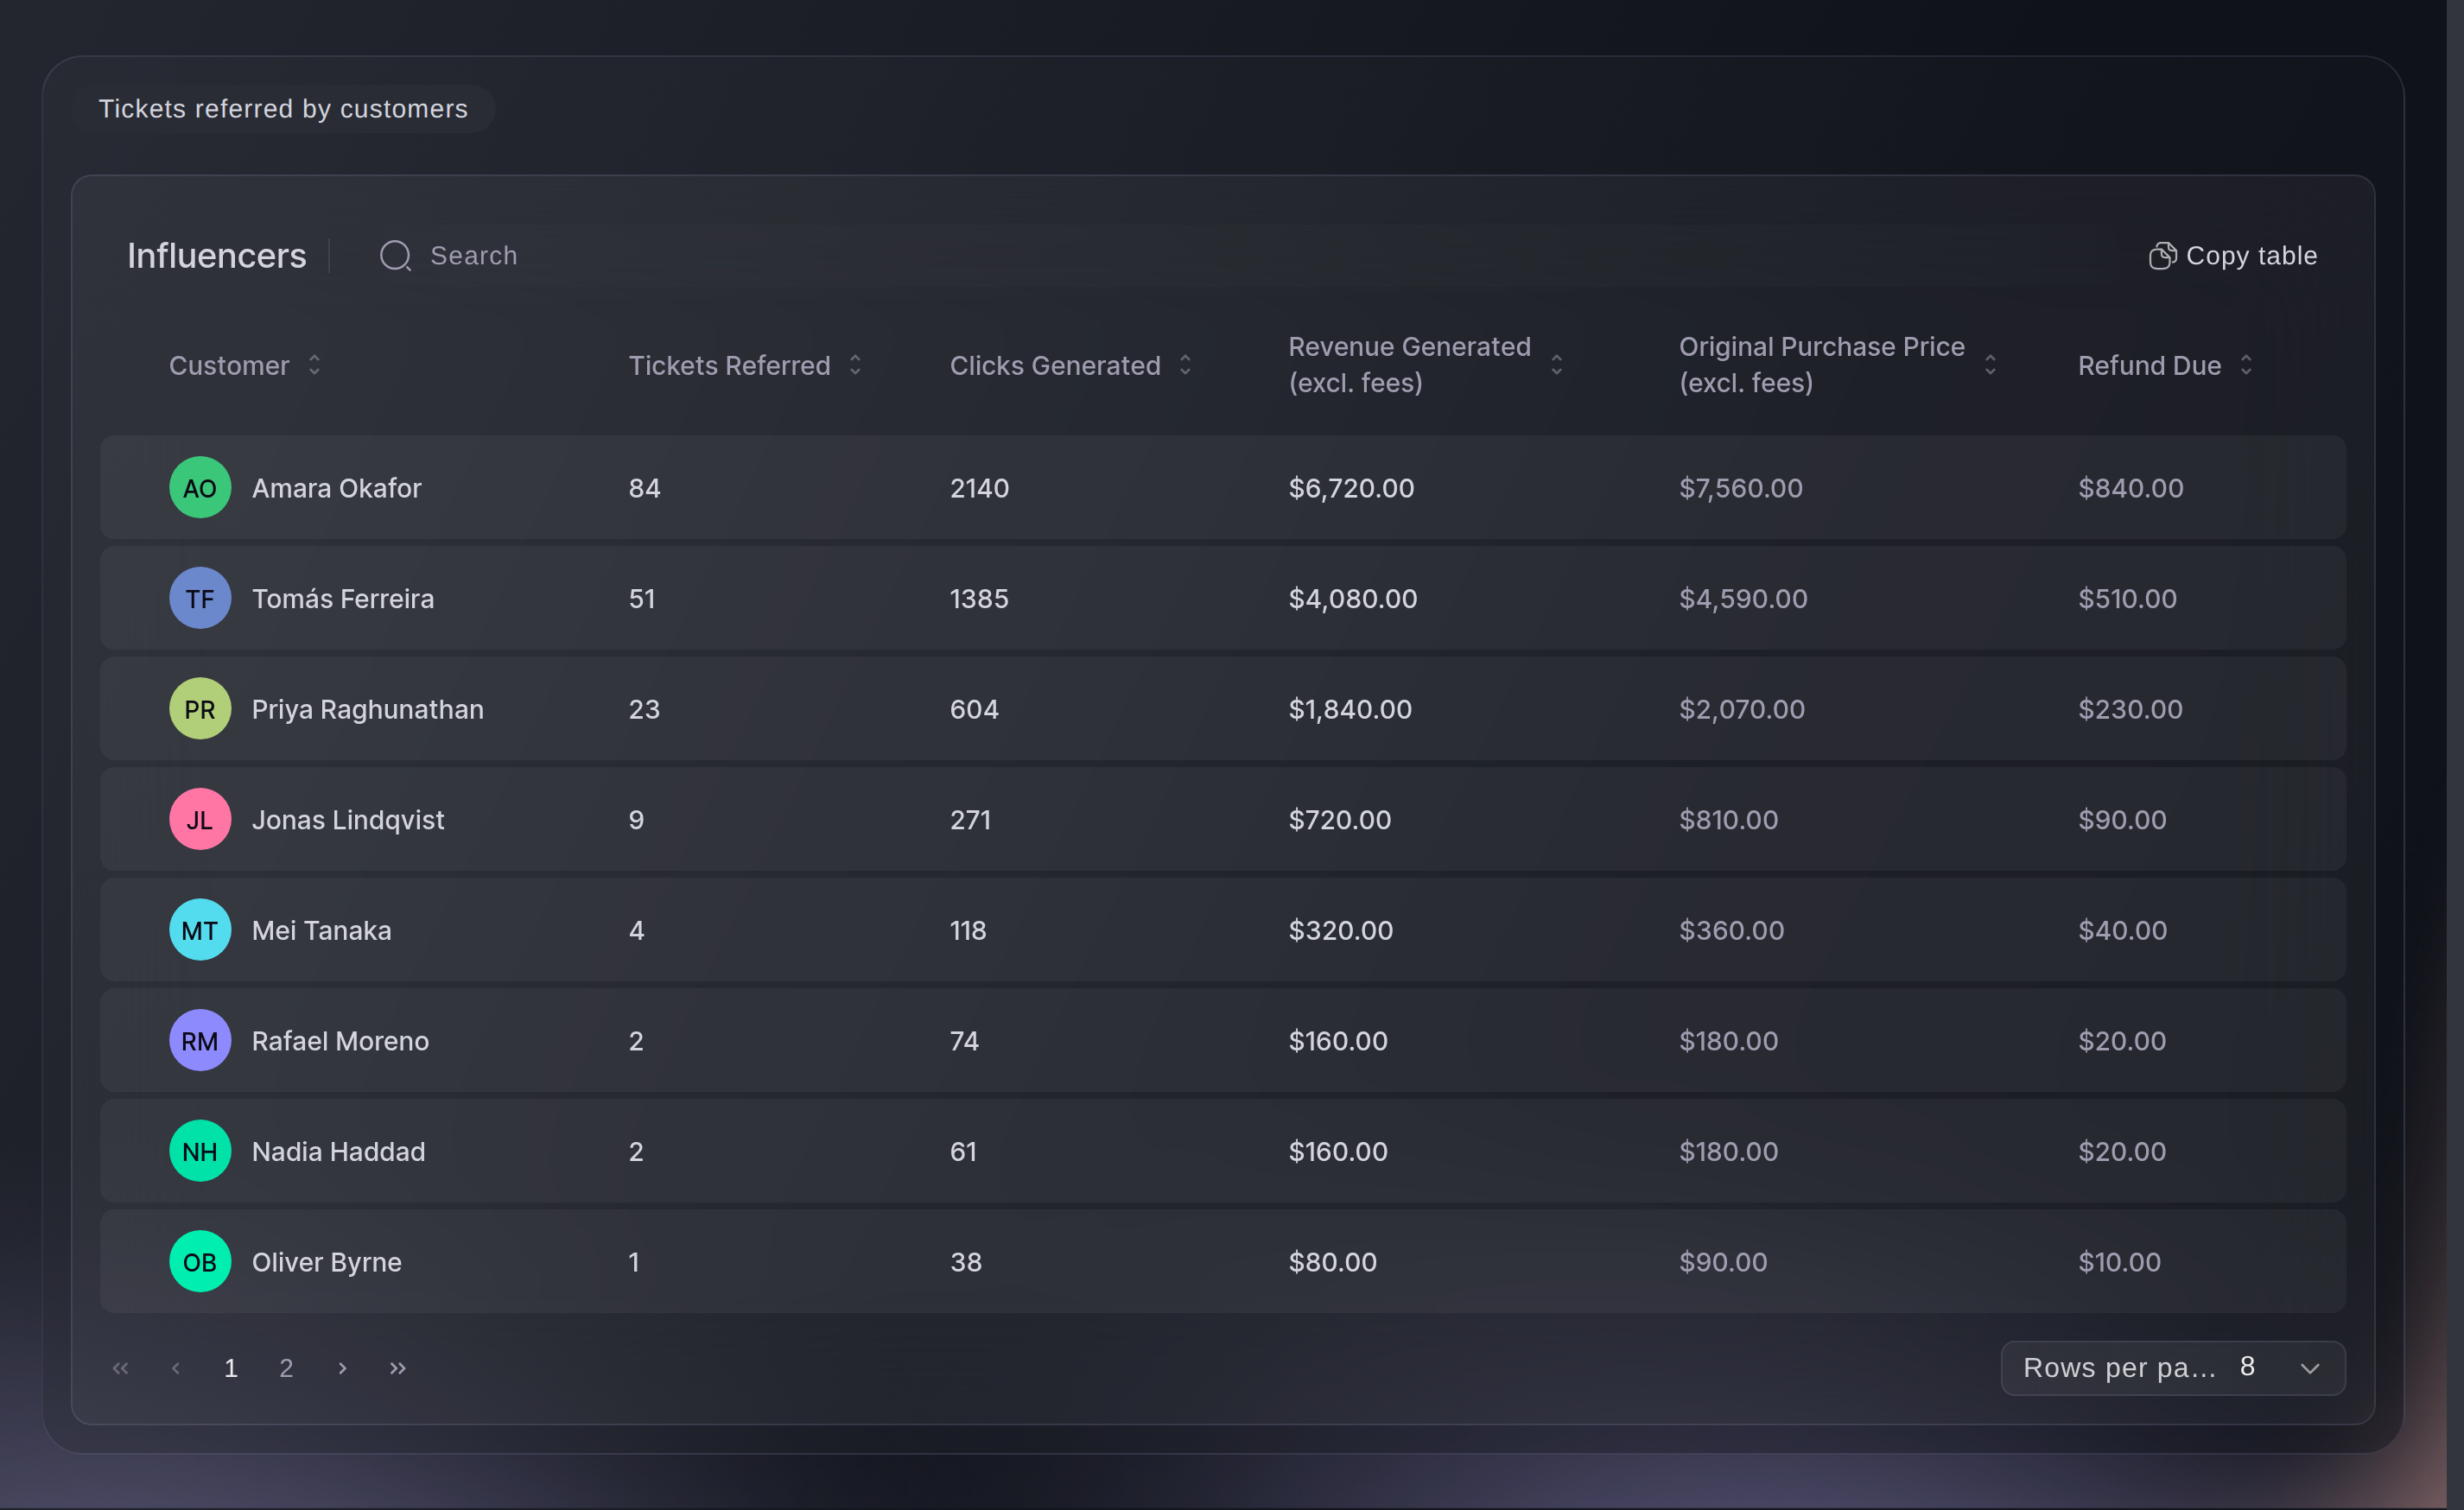
Influencers, Tickets referred by customers.


See these figures for your own event
Create a free account and this report fills as your tickets sell. You see the same figures for your own event from the first sale.
No setup fees. No required monthly ticketing fee. No credit card required.
Or have it done for you
Fai and your own AI assistant through our MCP server can both get your referral figures and explain what they show.
In your dashboard, with Fai
Look at the referral results for this event and tell me who brought in the most sales and whether the reward is paying for itself
From your own assistant, over MCP
Connect your assistant to our MCP server and ask it:
Keep --read-only in your MCP configuration. This task only reads data, so your assistant does not need tools that make changes.
Find my event by name, then show its referral results, who brought in the most sales and which referrers had lots of clicks but few sales
From your terminal
Install the CLI from our CLI page, sign in with ticketfairy auth login, and choose the brand you are working on with ticketfairy brand use <BRAND_ID>. ticketfairy brand list and ticketfairy event list show the IDs the other commands use.
You need an owner, admin or Stats login to see the money. A Limited Stats login gets the same rows with it hidden. Set your rewards in your dashboard.
Your referrers and what each of them brought in
ticketfairy event stats <EVENT_ID> --metric referrals
The same figures, ready for a spreadsheet
ticketfairy event stats <EVENT_ID> --metric referrals --output csv
Let Fai do it for you
Fai works inside your Ticket Fairy dashboard. Create your account, open Fai and paste the prompt above.
No setup fees. No required monthly ticketing fee. No credit card required.
Questions you might have
- Which currency are these figures in?
- Your event's own, unless you sell in more than one currency. Then a currency selector appears and the sections above the table follow what you pick, while the table shows a separate revenue column for each currency.
- Why are all my referral figures zero?
- No buyer has shared a referral link yet, or those shares have not yet led to clicks or sales. The sharing and click figures can increase before the first referred sale.
- Does Influencers include my promoters?
- No. Influencers counts buyers who share their referral links. Sales from event team members appear in Sales by Promoter instead, even when the team member has bought a ticket.
- Do these figures cover only this event?
- The share rate covers this event only. If you link events for referrals, the revenue, sales, clicks and referrer rows include those linked events too.
- Why can't I see the revenue columns?
- A Limited Stats login hides revenue generated and the original purchase price; a plain Stats login keeps them. Ask an owner or an admin on the event to change your role if you need the money figures.
- What is the difference between revenue generated and original purchase price?
- Revenue generated is the ticket revenue from purchases made through that buyer's referral link, excluding fees. The original purchase price is what they paid for their own ticket, and their rebate is a percentage of that rather than of what they sold.
- What does refund due show?
- It is the total rebate that referrer has earned from the sales they brought in. It does not tell you whether Ticket Fairy has already issued the refund.
- What is a good return per $1 in rebates?
- Five to ten times, which is the band shown beside your return for referral programmes. A return below five times may mean the reward is too generous for the ticket revenue it brings in.
- My event has no Influencers report. Where is it?
- You can switch referrals off for one event, and Influencers then dims with a way to turn them back on. Check that event's own settings rather than your brand's.
Still have a question?
Book a demo and we will answer it on a call, on your kind of event. Or create your account and see it for yourself.
No setup fees. No required monthly ticketing fee. No credit card required.
Related guides
Do this on your own event
Create your account, build your event and follow the steps in your own dashboard. You do not need to book a sales call.