In today’s crowded festival market, successful festival organizers rely on data, not guesswork, to drive their marketing. Gone are the days of plastering posters and praying for ticket sales – modern festival marketing means tracking every click, like, and ticket purchase to see what really boosts attendance. By measuring marketing performance rigorously and optimising campaigns in real-time, festival producers can ensure every promotional dollar (or pound) is spent where it makes the most impact. This guide offers a step-by-step approach to becoming a data-driven festival marketer, covering tools to set up, key metrics to watch, and strategies to continuously improve your promotional efforts based on evidence.
Setting Up Your Analytics Foundation
Before diving into metrics, build a strong analytics foundation. This means equipping yourself with the right tools and processes to capture data from all marketing channels:
- Website & Ticketing Analytics: Start with a web analytics platform like Google Analytics (GA4). Install tracking code on your festival website (and if possible, integrate it with your ticketing pages). Define conversion goals for ticket purchases so you can see what traffic sources lead to sales. Many specialized festival ticketing software platforms – including Ticket Fairy – offer built-in analytics or integration with tools like Google Tag Manager to track pageviews and conversions. Ensure cross-domain tracking if your ticket checkout is on a separate site, so that a visitor’s journey from your site to the ticketing page is recorded as one continuous session.
- Tracking Links & UTM Codes: For every online ad, social post, or email campaign, use UTM-coded URLs or unique tracking links. These tiny snippets (e.g.
utm_source=Facebook&utm_campaign=EarlyBird) appended to your links feed data into Google Analytics, telling you exactly how a visitor found your ticket page. For example, create a tagged URL for your Twitter bio link and a different one for an Instagram Story swipe-up; later you can compare which brought more traffic and sales. The idea is to attribute ticket buyer traffic to specific campaigns and channels. - Pixel Tracking (Retargeting): Install the Facebook Pixel, Google Ads tag, or other ad platform pixels on your site. These trackers allow you to retarget people who showed interest (like those who visited the tickets page but didn’t buy) with follow-up ads. They also report back conversion events. For instance, with the Facebook Pixel in place, you can see exactly how many ticket purchases came from your Facebook/Instagram ads and even which ad creative drove them. Retargeting data is incredibly valuable – a visitor who didn’t buy initially might just need a reminder or incentive later, and the data will help you identify and reach them.
- Social Media and Email Analytics: Make the most of built-in analytics on platforms like Facebook, Instagram, YouTube, TikTok, and Twitter. These won’t directly tell you ticket sales, but they show engagement stats (views, likes, shares, click-throughs) for each post or ad. Watch these closely to learn what content resonates with your audience. High engagement on a lineup announcement video, for example, is a signal to perhaps boost that post or create more content like it. Similarly, track email marketing performance via your email service provider (open rates, click rates, and subsequent ticket purchases via your tracked links). If your email newsletter has a 5% click-through rate and drives 50 ticket sales, whereas a social post with an equivalent reach drives 5 sales, that’s a clear hint to invest more in email marketing.
- Promo Codes and Referral Tracking: Analytics aren’t just digital – you can track offline and partner promotions too. Set up unique promo codes or referral links for each campaign, partner, or influencer promoting your festival. For example, give a radio station a code like RADIO10 for a 10% discount, and an Instagram influencer a code INSTAGRAM5 for 5% off. Come ticket sale time, you’ll see which codes get redeemed and attribute those sales accordingly by integrating ticketing with marketing bundles and promo codes. If RADIO10 was used 100 times and INSTAGRAM5 only 20, the data clearly shows the radio partnership drove more sales, similar to how you might assign unique codes to blogs or similar channels. You can then double down on that effective channel (and maybe renegotiate with the less effective influencer). Many successful festivals implement ambassador or referral programs this way – each ambassador gets a personal link or code, turning passionate fans into marketers and allowing you to track exactly who they bring in. Not only does this boost sales via word-of-mouth, it feeds you invaluable data on which communities or personalities connect best with your event.
By setting up these tools and practices, you create a base of actionable data. Think of it as wiring up the festival marketing “dashboard” – now you can see what’s happening under the hood of your campaigns at all times.
Key Metrics to Measure Performance
Once your analytics are in place, it’s time to decide which metrics matter most for evaluating your festival’s marketing success. Here are the key performance indicators (KPIs) that experienced festival marketers track closely:
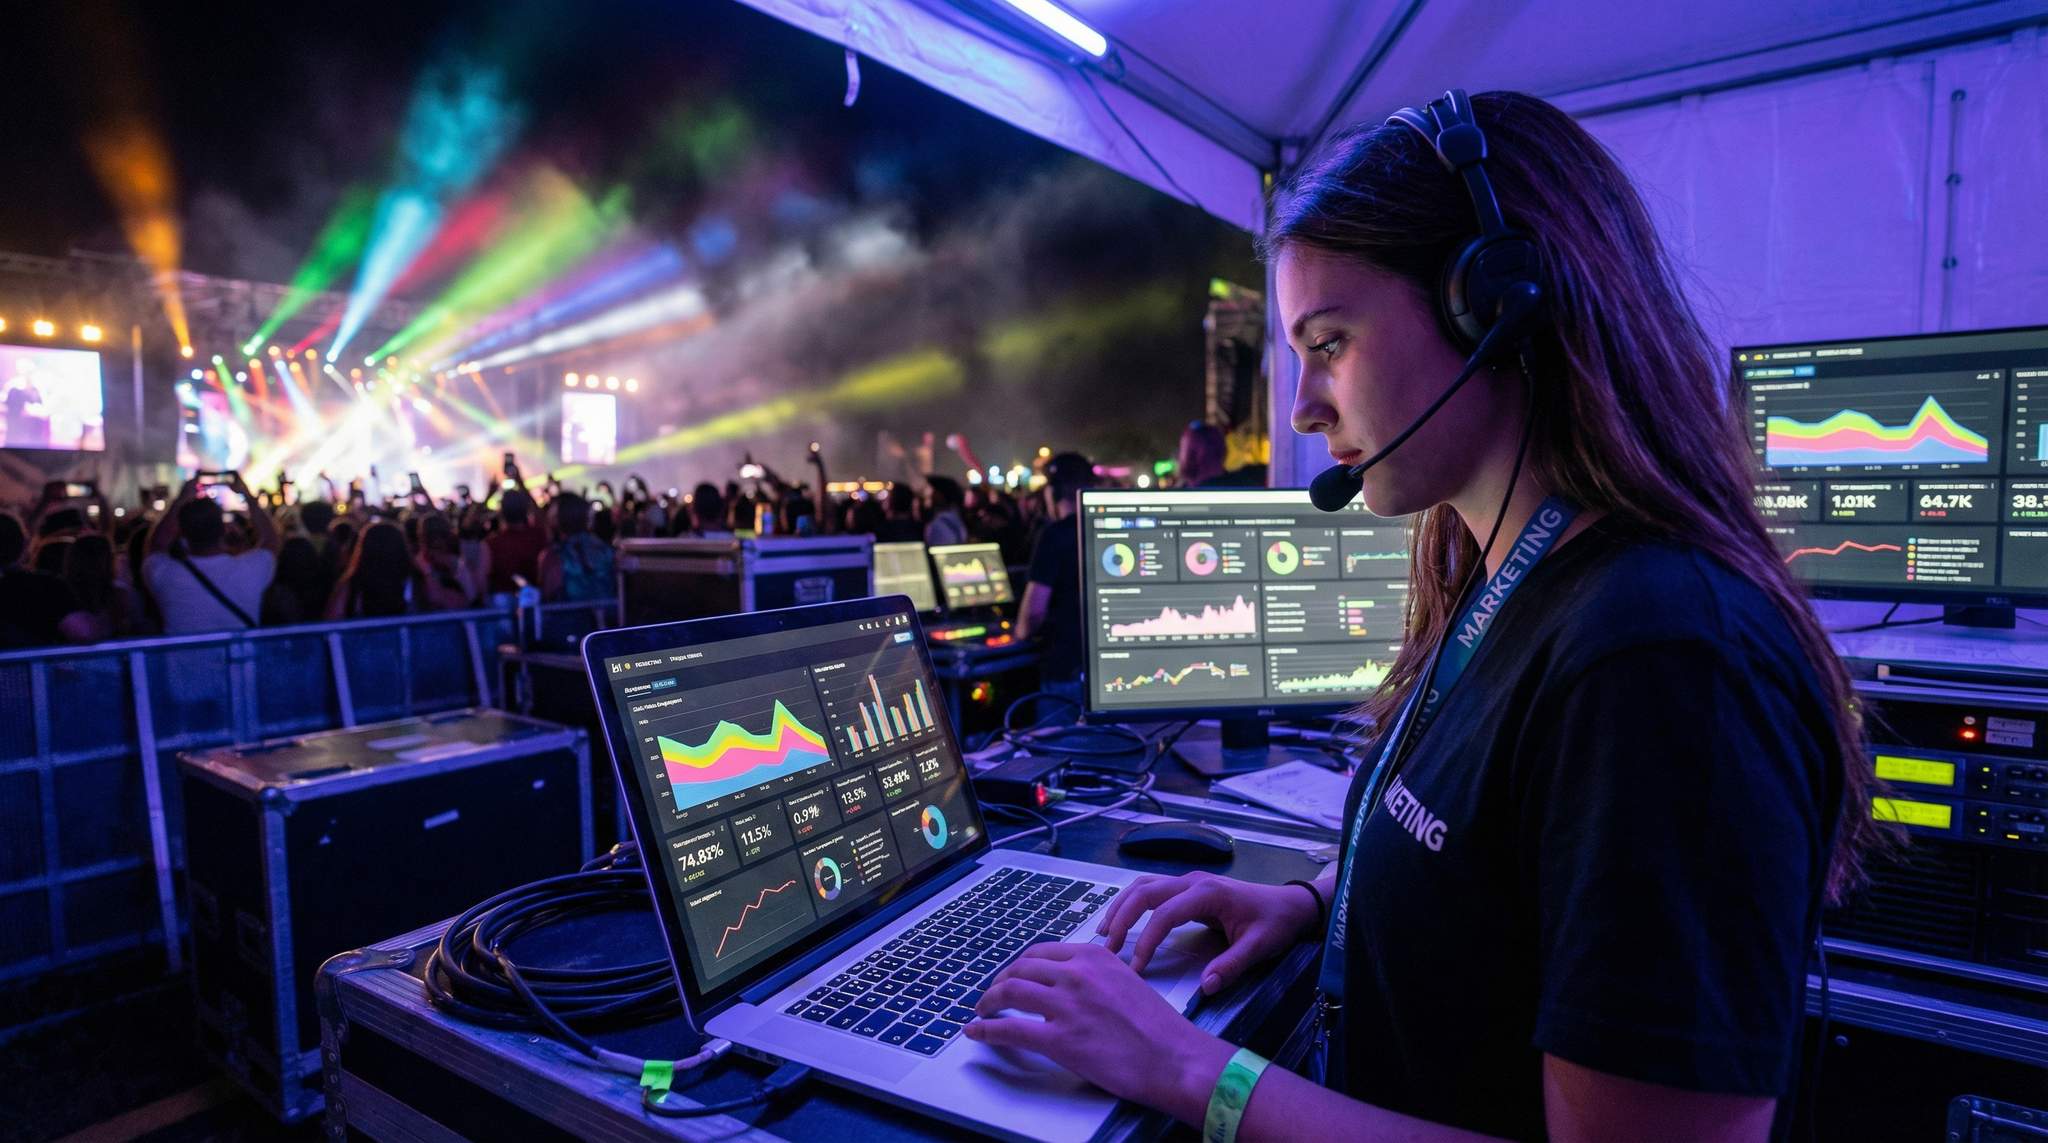
Data-Driven Event Marketing
Track ticket sales, demographics, marketing ROI, and social reach in real time. Exportable reports give you the insights to make smarter decisions.
- Ticket Sales & Conversion Rate: This is the ultimate metric – how many tickets are selling, and what percentage of people who show interest actually buy? Conversion rate can be measured at multiple stages. For instance, website conversion rate = (ticket purchases) / (website visitors). If 10,000 people visit your ticket page and 500 purchase, that’s a 5% conversion rate. You can further break this down by channel: what’s the conversion rate of Facebook ad traffic vs. organic search traffic? A low conversion rate might indicate a mismatch in your marketing (perhaps your ad attracted people who aren’t genuinely interested, or your ticket page content didn’t convince them). It could also flag technical issues (if the checkout process is cumbersome, many will drop off). Tracking conversion rates by source helps pinpoint where the funnel is strong or weak.
- Cost Per Ticket Sold (CPA): Also known as customer acquisition cost for your festival marketing. Calculate this per channel by dividing the money spent on a marketing channel by the number of tickets it directly sold. For example, if you spent $500 on Google Ads and it led to 50 ticket purchases, the cost per acquisition is $10 per ticket. Every channel will have a different CPA – one might be $5 (very efficient), another $50 (less so). Comparing these tells you where your marketing spend is yielding the best bang for the buck. If a certain Instagram campaign costs $20 per ticket and a radio ad campaign costs $100 per ticket, you know which one deserves more budget next year! Keep in mind the lifetime value of a festival attendee could be more than just one ticket (some fans will come back every year), but as a starting point CPA is great for channel-by-channel efficiency.
- Return on Investment (ROI) / Return on Ad Spend (ROAS): Measuring ROI for each channel or campaign shows the overall profitability of your marketing efforts. To get ROI as a percentage, use the formula: ROI = (Revenue from ticket sales attributed to campaign – Campaign cost) / Campaign cost x 100%. For instance, if a series of Facebook ads cost $5,000 and you can attribute $20,000 in ticket revenue to those ads, the ROI = ((20,000 – 5,000) / 5,000) x 100% = 300% (a 3:1 return). ROAS is a similar concept often used for online ads, expressed as a multiple. A ROAS of 5x means $5 revenue per $1 spent. As an illustration, one spring festival’s online ad campaign spent around $4,190 and generated $44,576 in ticket sales – an impressive 10.7x ROAS, according to Paton Digital Marketing’s full-funnel Meta strategy case study. Such data was eye-opening, revealing that their social ad strategy was extremely profitable, especially when they employed re-engagement tactics, where retargeting campaigns drove double-digit ROAS on their own. The goal is to identify which marketing activities make money (high ROI) and which might be losing money (ROI below 100% or ROAS below 1x), so you can adjust accordingly.
- Social Media Engagement & Referral Traffic: Engagement metrics – likes, shares, comments, video views – show how well your content is resonating. Track these for each post and platform, but don’t stop at vanity metrics. Check how engagement translates into action. If a funny TikTok video got 100,000 views but negligible ticket sales, whereas a targeted Facebook post got 1,000 views but drove 50 tickets, the smaller engaged audience was far more valuable. Use link tracking to see how much traffic each social platform sends to your site and how that traffic converts. Also pay attention to social sentiment (are comments positive? is there buzz around your lineup announcement?) as a qualitative metric that can signal if your messaging is hitting the mark. High engagement is a good sign your content is share-worthy – which can amplify reach for free – but always connect it to the ticket sales data to confirm those engaging are actually buying.
- Email Marketing Metrics: For festivals that use email newsletters or presale invites, email can be a powerhouse channel. Key metrics here are open rate (what percentage opened the email), click-through rate (who clicked the ticket link), and ultimately conversion (who bought tickets after clicking). An email campaign might show a 25% open rate and 5% click rate – but the real success is in how many ticket sales it generated. By using dedicated tracking links or codes in emails, you can calculate email’s ROI as well. Often, past attendees and subscribers are highly motivated buyers; data may reveal that email has one of the lowest cost per ticket (since sending emails is cheap) and a high conversion rate. Many festival producers find that a personalised email to last year’s attendees yields a surge of early ticket sales at virtually no cost – a data-backed reminder of the value of nurturing your attendee community.
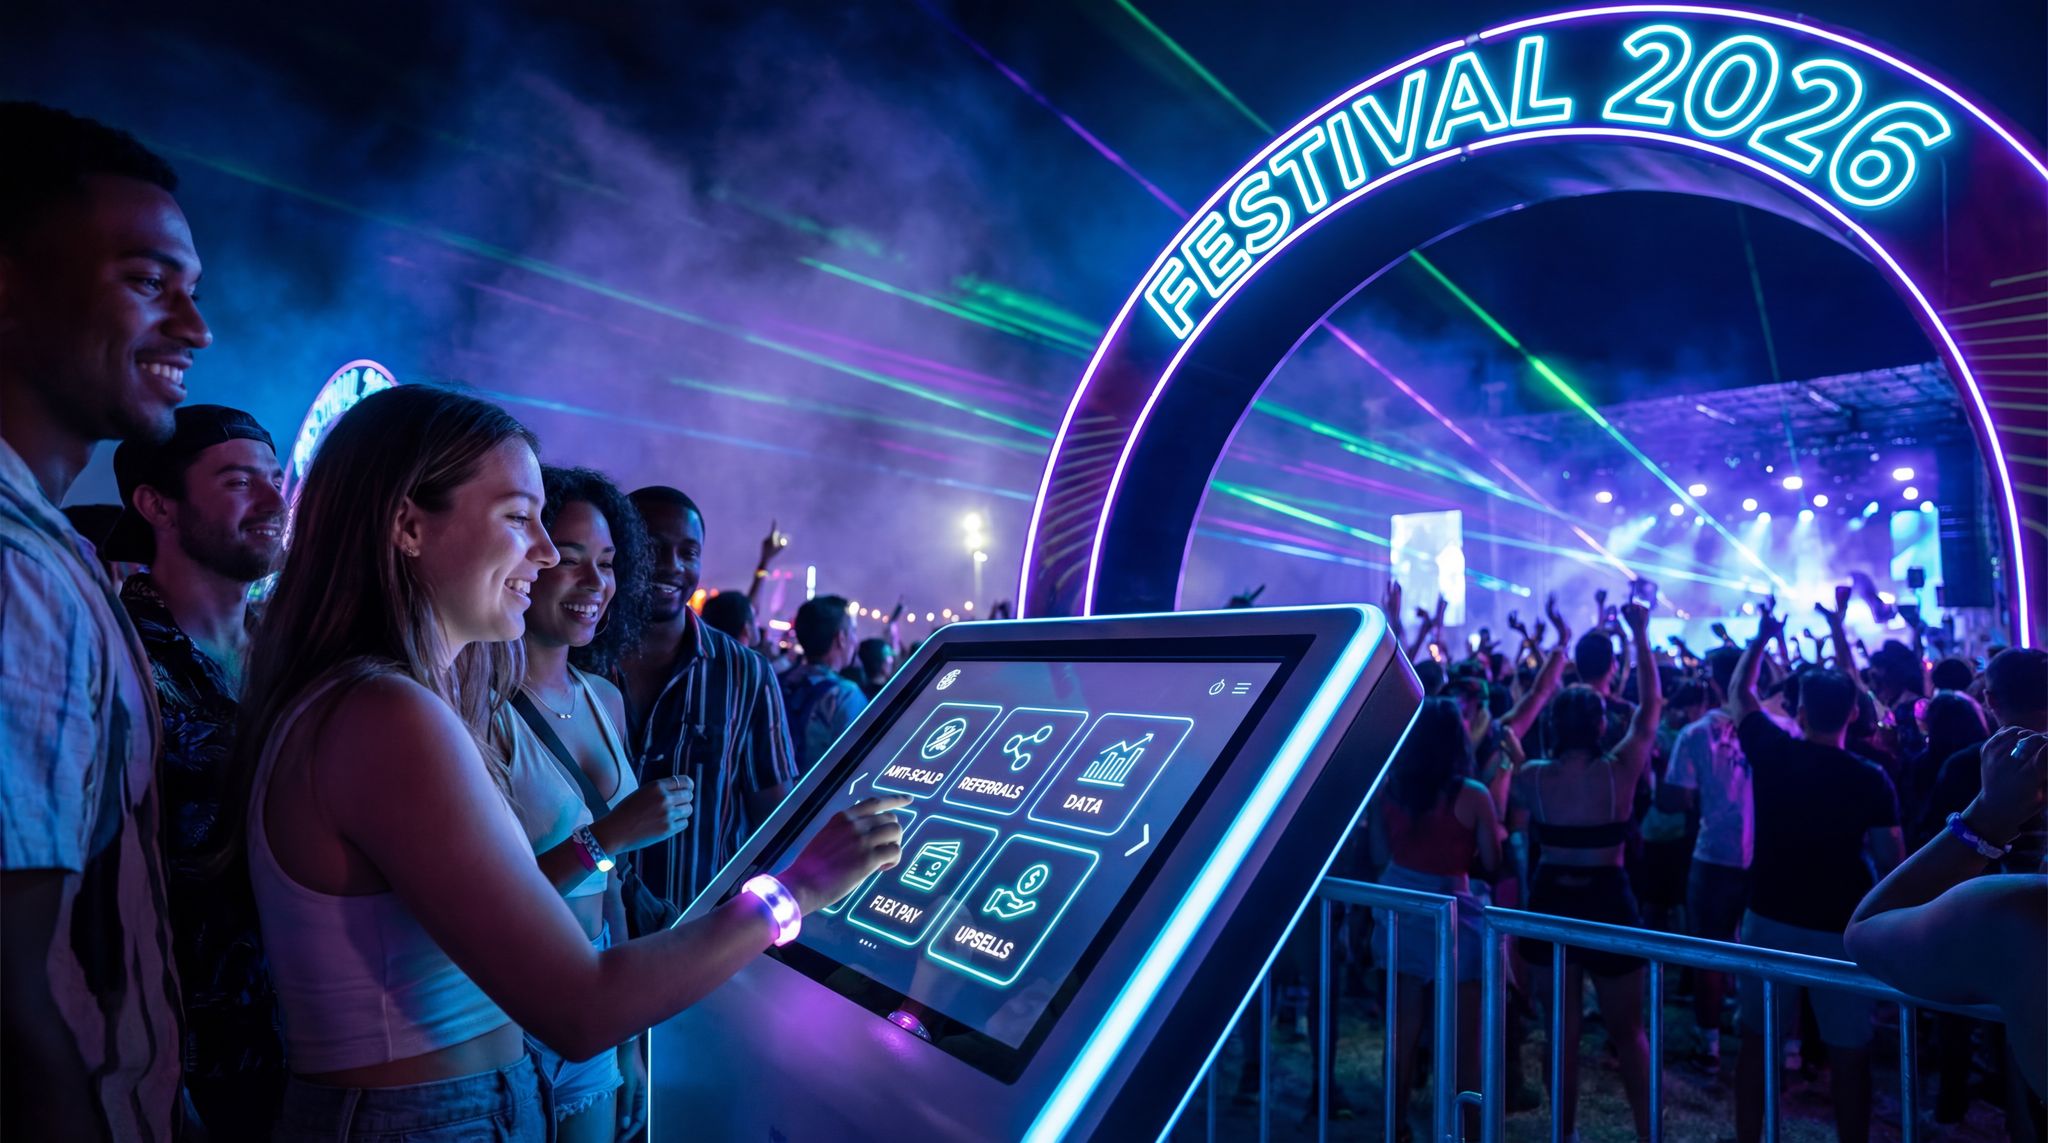
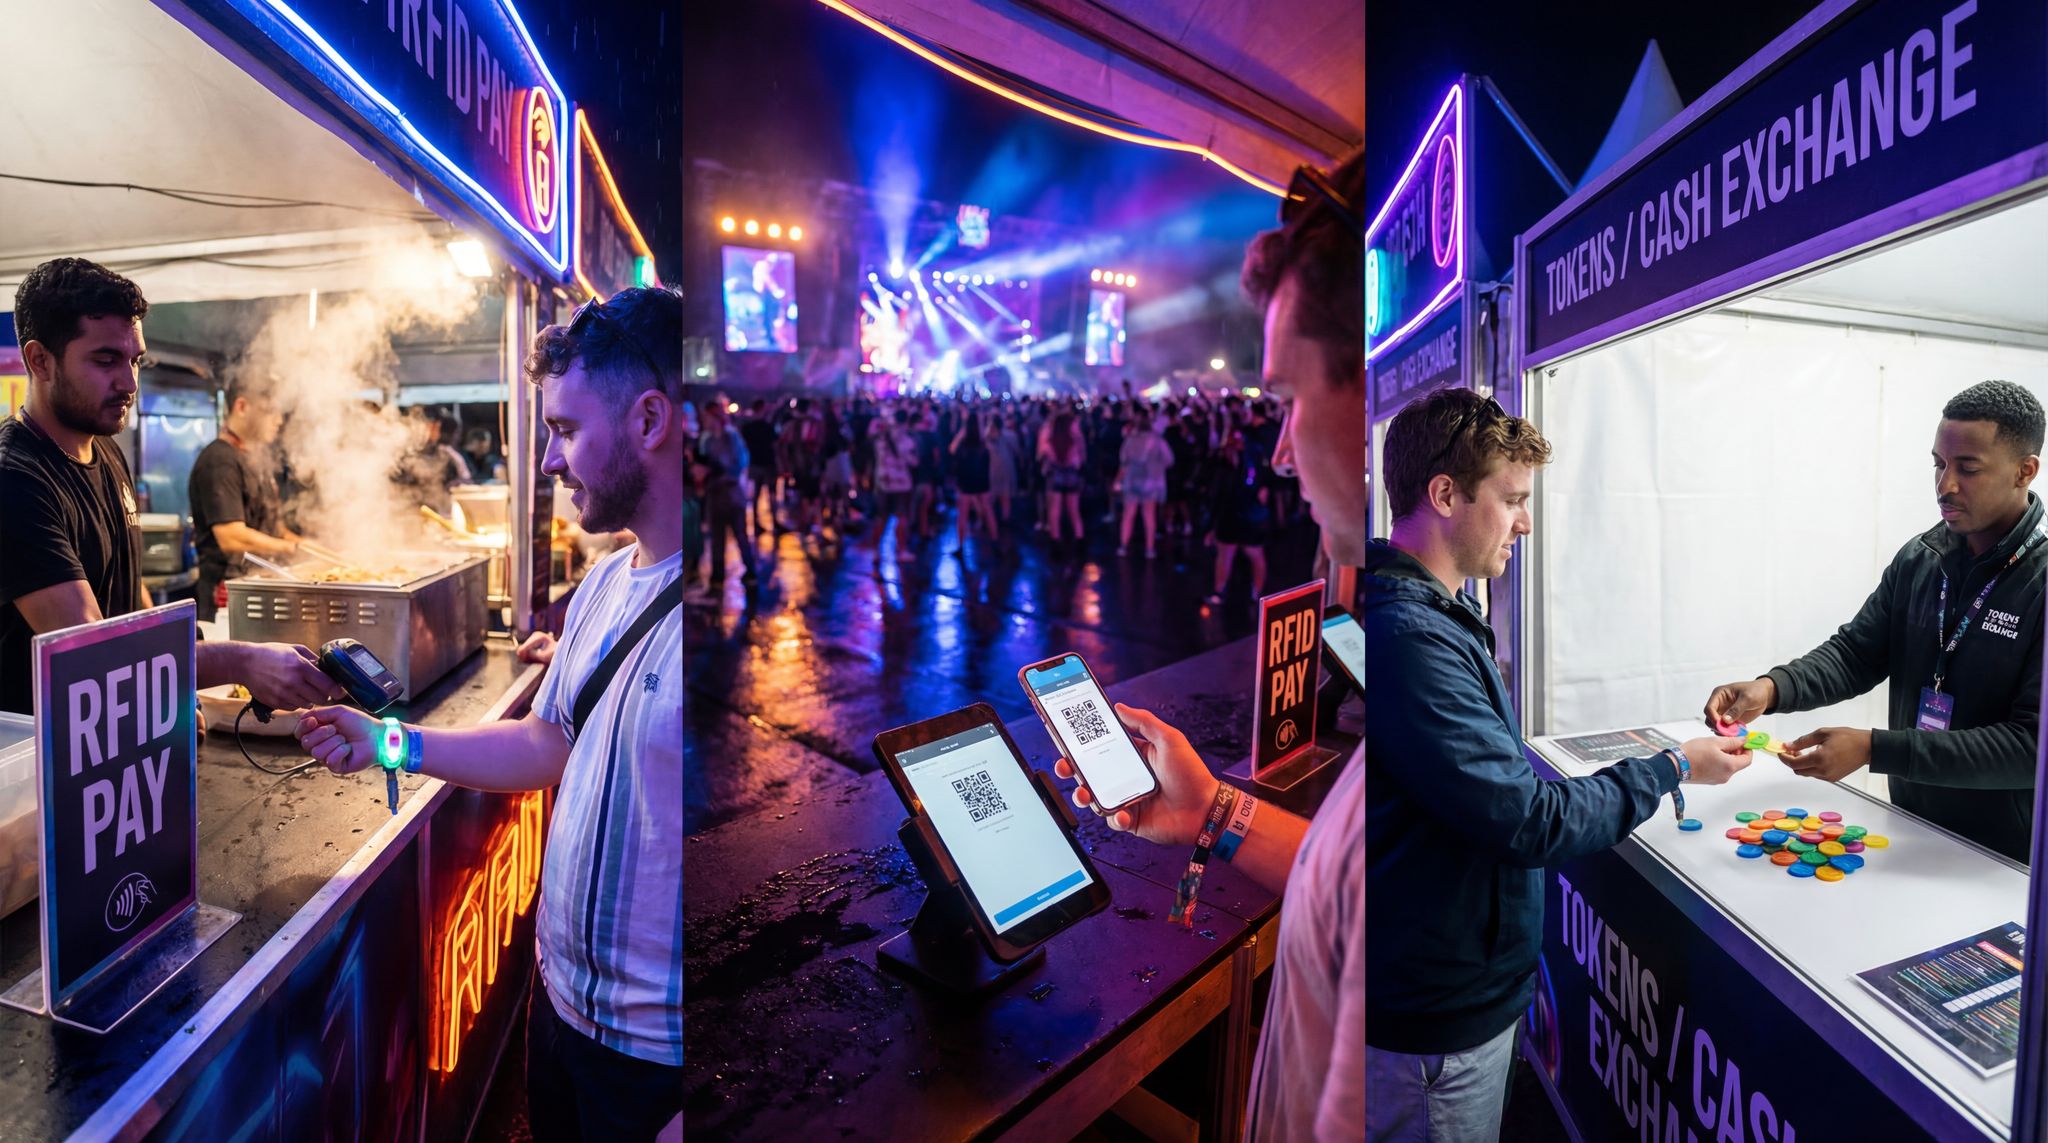
- On-Site Behaviour & Feedback: This strays beyond pure marketing metrics, but it’s worth noting. Data from on-site or post-event can close the loop on your marketing strategy. For instance, track check-ins vs. tickets sold (to calculate no-show rate) and survey attendees on how they heard about the festival. If a post-event survey shows 40% of attendees heard about the festival from a friend, that’s an indicator to perhaps invest more in referral programs or social share incentives. If 30% say they came due to seeing a video on Instagram, that validates your social media spend. Some festivals also use RFID wristbands or mobile app analytics during the event to see attendee movement and engagement with sponsors, which can feed back into marketing messaging for next time (e.g., highlighting popular attractions). While these on-site data points are not traditional marketing KPIs, they help paint a full picture of what drives attendee interest and satisfaction – which ultimately impacts your marketing success through word-of-mouth and repeat attendance.
- Music Performance Analytics for Festivals: Beyond standard marketing metrics, tracking the draw of specific artists is crucial. Music performance analytics for festivals involve correlating lineup announcements, specific artist promo codes, and social media mentions of individual acts with spikes in ticket sales. If data reveals that a mid-tier electronic act is driving more conversions than a higher-billed indie band, you can adjust your ad spend to highlight the better-performing artist, ensuring your marketing budget aligns with actual fan demand.
Turning Data into Decisions: Optimising Your Campaigns
Collecting data is half the battle – the real power of data-driven marketing lies in acting on insights. Top festival organizers treat their marketing plan as a living, adjustable strategy that evolves with the incoming data. Here’s how to put your data to work and continually optimise your campaigns:
- Identify What’s Working (and What’s Not): Regularly review your dashboard of metrics, channel by channel. Which channels are selling the most tickets, and at the lowest cost? Perhaps you discover that Google Search Ads are bringing 200 ticket sales at a low cost per ticket, while a pricey print media partnership brought only 20. That data tells a clear story – invest more in search ads where you’re seeing ROI, and re-think or cut what isn’t pulling its weight. Similarly, within a channel, identify the best performers. Maybe one Facebook ad campaign targeting a specific interest group has a 3% conversion rate, while another targeting a different demographic has 0.5%. With those insights, you might shift budget into the audience that converts better. This continuous curation of your marketing mix ensures budget is allocated based on evidence, not hunches.
- A/B Test and Experiment: Data-driven marketing is all about experimentation. Run A/B tests for your ads and content where possible – different headlines, images, call-to-action phrases, or send times – and let the metrics determine the winner. For example, you might test two versions of an email: one with the subject “Don’t Miss Out – 50% of Tickets Gone!” versus another “Join Us for an Unforgettable Experience”. If the first subject yields a 30% higher open rate and double the ticket sales, you’ve learned what motivates your audience. Apply that insight to future campaigns. On social media, you could experiment with short teaser videos vs. static flyers, or influencer takeovers vs. official posts. By changing one element at a time and measuring results, you build a knowledge base of what creative and messaging works best for your festival’s audience.
- Leverage Timing and Lifecycle Data: Look at when your sales occur relative to your marketing actions. Do you see ticket spikes the day after major announcements or ads? If data shows that 20% of your total tickets sell in the 48 hours after you reveal the lineup, you know those announcements are critical – and you might boost that period with extra ads or a flash sale to capitalize on the attention. Conversely, if sales are slow until the last two weeks before the event (common for local festivals), you might save some marketing budget for that final push when urgency is high. Data can also reveal patterns like “Ticket sales from students surged after semester exams ended” or “We sold many tickets on pay-day Fridays”. With such insights, you could time your campaigns (and special offers) to match when your audience is most ready to buy.
- Retarget and Recapture: As your tracking tools reveal user behavior, make use of retargeting to improve conversion. For instance, if 1,000 people visited your ticket page but only 100 purchased (meaning 900 potential customers left), don’t consider them lost. Use Facebook/Instagram and Google retargeting campaigns to show those 900 folks a tailored message – “Don’t wait, tickets are selling fast!” or an incentive like “Get 10% off – finish your purchase today with code LASTCHANCE”. Because they already showed interest, this segment often converts at a higher rate when reminded. Many festivals have increased their total sales by setting up automated cart abandonment emails or ads that re-engage those who almost bought. It’s a second chance at conversion, guided by your data.
- Spotlight High-Performing Content and Partners: Dig into which specific marketing content or partners are driving engagement and sales. Your analytics might show that one particular after-movie video on YouTube is responsible for a large chunk of ticket click-throughs – so consider boosting that video or making more like it. Or you may find one influencer’s promo code outperformed others, suggesting that influencer’s audience is a goldmine for your festival’s genre. Feed that insight back into your strategy: perhaps offer that influencer a bigger role or collaboration next year, or seek out similar influencers. By identifying the creative assets and partnerships that yield the best results, you ensure your marketing resonates with authenticity. A great example is many music festivals partnering with popular local DJs or artists on their lineup to promote the event – when the data shows a certain DJ’s fan promo brought in 50+ ticket buyers, you’ve not only sold tickets but also strengthened a relationship that clearly has marketing value, giving you insight into who your most effective ambassadors are.
- Keep an Eye on Audience Segments: Data can often be segmented by audience demographics or geography, which offers clues on how to adjust promotions. Let’s say your ticketing data shows a surprising number of attendees are coming from a neighboring city or country – you might increase advertising in that region or forge local partnerships (like travel packages or regional media buys) to support those fans. On the other hand, if an expected demographic isn’t buying as many tickets as predicted, you might tweak your messaging to appeal more to them, or devote resources to the channels that demographic uses. For instance, younger audiences might respond better to TikTok content than Facebook. By aligning your channel strategy with audience data, you ensure you’re speaking to each group in the place and language that engages them.
- Budget Reallocation and Continuous Improvement: Make it routine after every major campaign (or midway through a long campaign) to pause and review performance. Pull up your cost per ticket and ROI per channel figures and ask, “If I had an extra $1,000, where should it go based on these results? And if I need to cut $1,000, what should I trim first?” Data-driven festival marketing is iterative: maybe you’ll discover radio ads aren’t worthwhile and shift those funds into digital ads or street team activations that showed better ROI. Over time, this practice can dramatically improve your marketing efficiency. Small tweaks compound into big gains – saving a few dollars per ticket in acquisition cost can mean tens of thousands saved on a large festival, or a sold-out show instead of half-empty grounds for a smaller event.
- Analyze User Behavior for Campaign Optimization: Advanced digital marketing strategies for festivals rely heavily on understanding how potential attendees interact with your site. By tracking user behavior—such as how long they stay on the lineup page or where they drop off in the checkout process—you can refine your approach. If analytics show users abandoning carts at the payment screen, simplifying the checkout flow or offering alternative payment methods can instantly boost conversions.
- Utilize Native Ticketing Platform Insights: Beyond external ad networks, your primary sales hub holds a wealth of actionable data. For organizers exploring how to use TheTicketFairy for marketing analytics, the key is diving into the promoter dashboard’s real-time reporting. You can monitor sales velocity, analyze buyer demographics, and evaluate the performance of specific referral links all in one place. By exporting pre-registration data or integrating it directly with your ad accounts, festival producers can build highly accurate lookalike audiences, effectively turning raw ticketing data into a refined digital marketing strategy.
Scaling Data-Driven Marketing for Any Festival
One common misconception is that only the mega-festivals with huge budgets can utilize data-driven marketing. In truth, festivals of any size and type can benefit from a measured, analytical approach – it’s about choosing the right scale of tools and metrics for your needs.
Planning a Festival?
Ticket Fairy's festival ticketing platform handles multi-day passes, RFID wristbands, and complex festival operations.
For a boutique local festival with say 1,000 attendees, data-driven marketing might mean tracking which community Facebook groups, flyers, or local press mentions correlate with ticket sales. You might use simple Google Analytics data to see that 300 ticket purchases came right after the town newspaper ran a story on the festival, confirming that PR effort was worth it. You might find that a particular city’s zip codes account for most sales, so you decide to focus more flyering or targeted social ads in those areas. Even a small festival can set up a Google Sheet to manually track promo code usage or referral counts – it doesn’t require fancy software, just a commitment to measuring outcomes.
On the flip side, a major international festival with hundreds of thousands of attendees will likely have a more sophisticated setup – a marketing team crunching data daily, perhaps a custom dashboard aggregating data from multiple ad platforms, social listening tools analyzing millions of impressions, and predictive models forecasting ticket sales. These big festivals might employ advanced techniques like lookalike audience targeting (using data about current ticket buyers to find similar people online) or multi-touch attribution models that credit each of several marketing touches for a single sale. For example, a large festival might analyze and realize that a combination of seeing a poster, then an email, then a Facebook ad was what typically converted a customer – and adjust spend to ensure that synergy continues. The principle remains the same though: use data to guide decisions. In big festivals, the stakes are higher and the volume of data is larger, but often the wins come from incremental improvements just as they do for smaller events (just worth a lot more in dollars).
No matter the scale, the most forward-thinking festival producers foster a culture of continuous learning. They encourage their teams to ask “what do the numbers show?” after each campaign and to celebrate decisions that led to improvements in ticket sales or engagement. They also understand the limits of data – not every marketing benefit is immediately quantifiable (e.g. long-term brand building or community goodwill), so they combine the quantitative with the qualitative. A data-driven mindset doesn’t replace creativity or intuition, but it does challenge you to verify ideas and measure success so you can repeat what works.
Frequently Asked Questions
How do you use Ticket Fairy for marketing analytics?
Learning how to use Ticket Fairy for marketing analytics involves leveraging its built-in dashboard to track real-time ticket sales, demographic data, and referral sources. Promoters can generate unique tracking links for influencers and partners, monitor ad campaign ROI directly within the platform, and utilize automated pre-registration data to build highly targeted custom audiences for future ad spends.
How does user behavior impact digital marketing strategies for festivals?
Effective digital marketing strategies for festivals use user behavior data—such as website navigation paths, time spent on lineup pages, and cart abandonment rates—to drive campaign optimization. By understanding exactly where potential buyers lose interest, organizers can tweak ad messaging, streamline the checkout process, and deploy targeted retargeting ads to recapture lost sales.