The 2026 Imperative: Proving Sponsor ROI
Sponsors Demand Digital-Grade ROI Metrics
In 2026, event sponsors are no longer impressed by vague “exposure” claims – they demand hard data on what their sponsorship delivers. Sponsorship now accounts for roughly 12% of a brand’s marketing budget, according to Lumency’s 2024 global sponsorship trends report, and global brands poured around $97 billion into sponsorships in 2022, a figure projected to nearly double to $190 billion by 2030, based on annual global sponsorship market analysis. With such major investments, sponsors expect the same level of data-driven ROI proof that they get from online advertising, a shift towards measurable return on investment metrics. As one industry report notes, sponsors today insist on clear metrics like impressions, engagement time, lead capture, and even revenue influence – not just attendee counts, as highlighted in recent reports on data-driven values-aligned partnerships. In short, brands are treating event partnerships like targeted ad buys, and events that can’t deliver measurable results risk losing deals, as brands increasingly favor organizers who can measure impact.
A Competitive Sponsorship Landscape
The mid-2020s have seen an explosion of events worldwide, which means sponsors have countless options. Major global spectacles (World Cups, Olympics) soak up huge advertising budgets, forcing other events to work harder to prove unique value. With sponsorship spending surging, brands can afford to be choosy – they scrutinize each opportunity for clear ROI and will favor organizers who can back up promises with data. For event organizers, this competitive landscape means ROI proof has become a key differentiator. Festivals, venues, and conferences alike must show they can deliver the specific audiences, engagement, and outcomes a sponsor cares about. Sponsors now often ask point-blank: “Was it worth it?” – and organizers need concrete answers.
ROI and Long-Term Partnership Value
Proving ROI isn’t just about justifying a one-time sponsorship fee – it’s the key to securing repeat partnerships and multi-year deals. Experienced organizers treat every sponsorship as if renewal depends on the results, focusing on media impressions for sponsored content. When sponsors receive data-packed reports demonstrating that their goals were met or exceeded, they are far more likely to renew and even increase their investment in future events, aiming to maximize ROI through tech-powered activations. This success is often tracked utilizing key metrics and attendee feedback. Conversely, if ROI remains murky, sponsors may take their budget elsewhere next year. Beyond retention, reliable ROI metrics also build trust and credibility. Providing honest, granular data (even if some metrics underperform) shows transparency and positions the organizer as a strategic partner focused on outcomes, not just a salesperson. In many cases, the post-event ROI report is used by the sponsor’s own team to justify the spend internally, highlighting the need to report on revenue growth – making your sponsor contact look like a hero. Thus, proving sponsor ROI isn’t just an analytic exercise; it’s a relationship investment that can secure your event’s financial future.
RFID & NFC Tracking: Measuring Physical Engagement
How RFID Captures Attendee Behavior
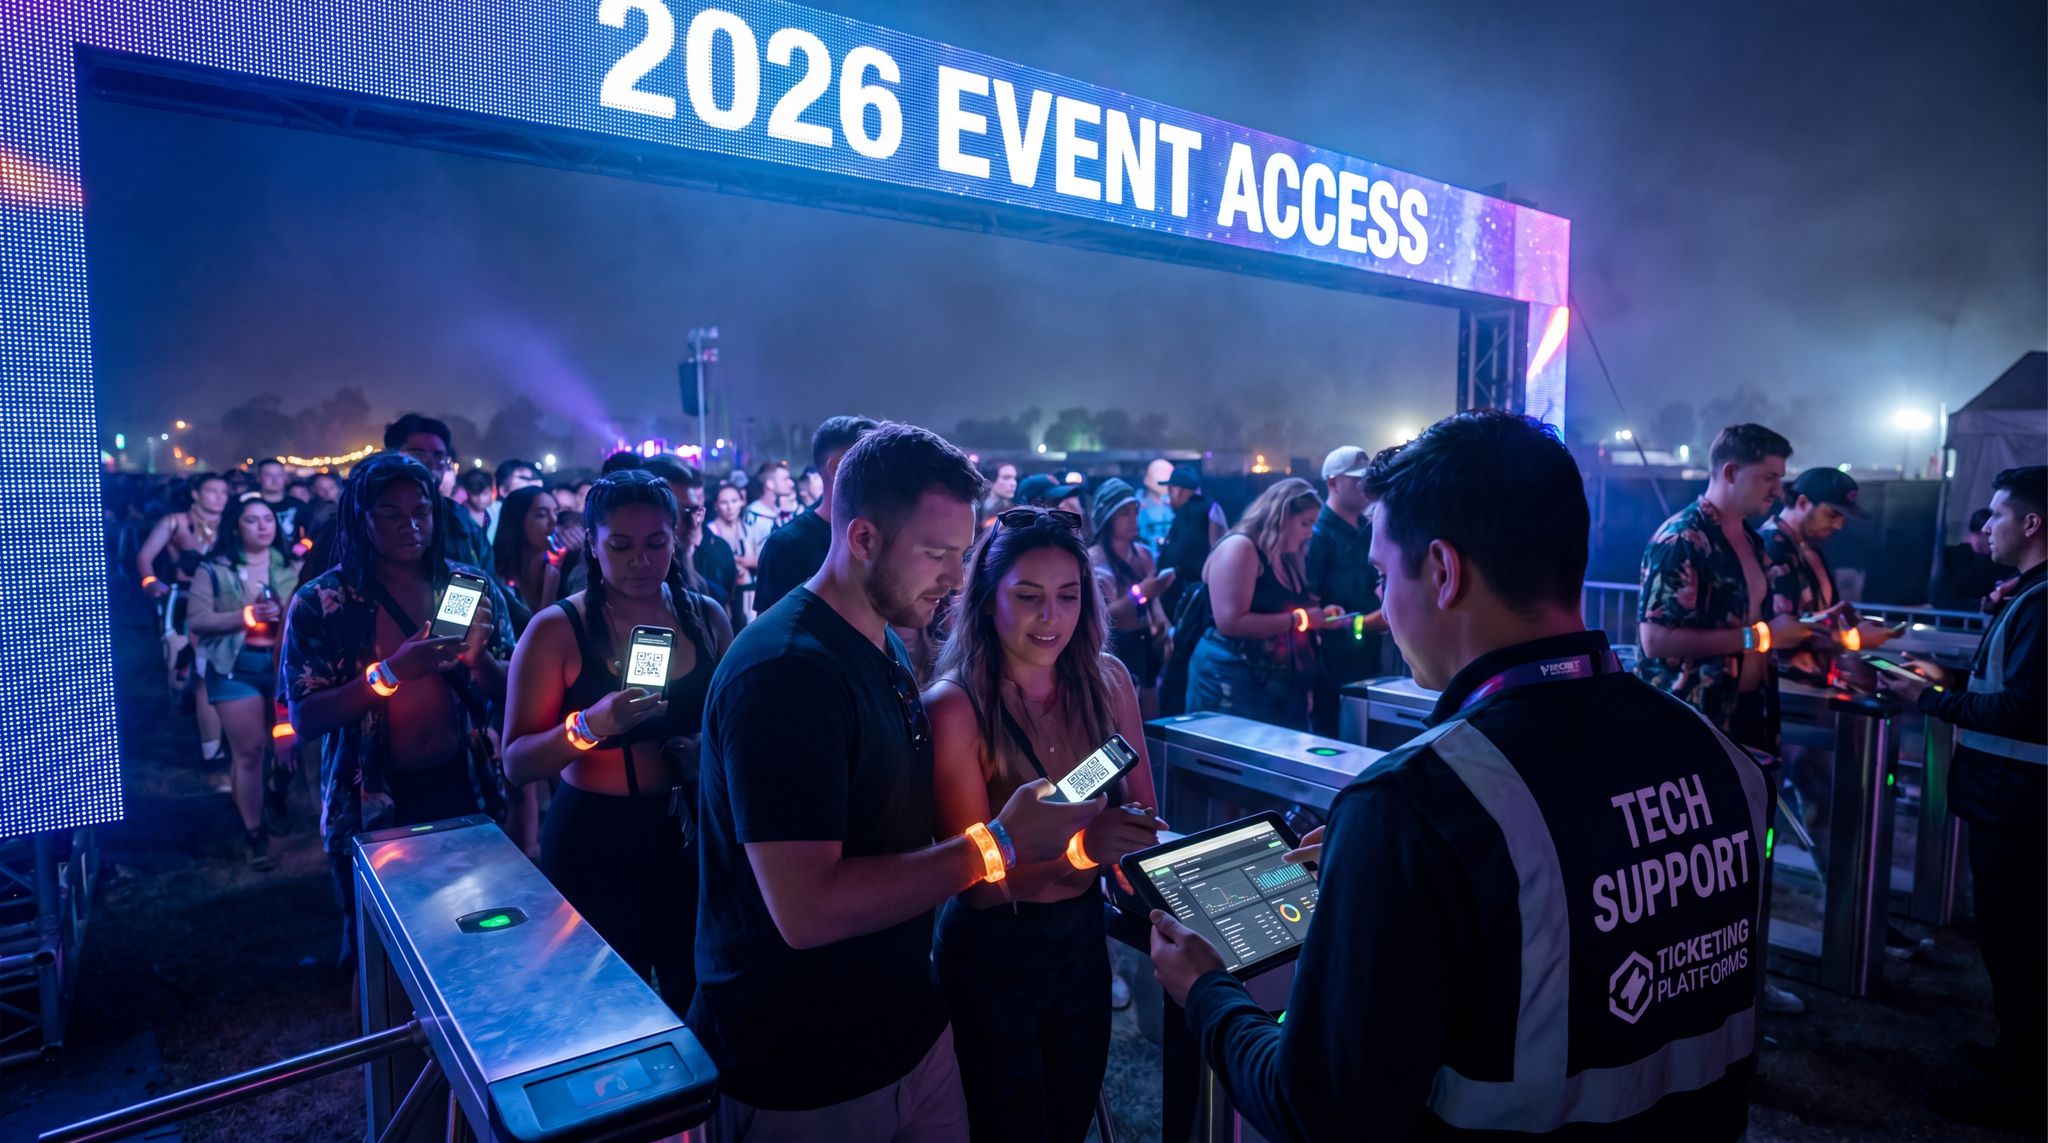
Radio Frequency Identification (RFID) and Near-Field Communication (NFC) technologies have become indispensable for tracking on-site attendee interactions. By issuing attendees smart wristbands or badges embedded with RFID/NFC chips, events can seamlessly log when and where attendees engage. When an attendee taps their wristband at a checkpoint – whether that’s an entry gate, a sponsor’s booth, or an activation – the system records the time and location. Modern RFID systems can handle thousands of scans per minute with high accuracy, enabling real-time crowd insights. This means organizers can monitor attendee flow through sponsor zones, measure dwell times, and even gauge repeat visits. For example, at a 50,000-person festival, an RFID access control system might log 500,000+ zone entries over a weekend, showing exactly how many people visited each sponsored activation. This data forms a factual baseline for sponsor ROI: instead of guessing foot traffic, you have precise counts of how many attendees engaged with a sponsor’s experience.
Tracking Sponsor Booth Visits and Dwell Time
One of the most valuable uses of RFID tracking is to quantify engagement at sponsor booths and activations. By deploying RFID readers at a sponsor’s installation (e.g. at the booth entrance or specific touchpoints within a larger sponsored area), organizers can count unique visitors and total visits. Additionally, by recording when a person enters and exits a zone, RFID data can calculate dwell time – how long attendees spend engaging with the sponsor. A tech conference, for instance, might find that the average attendee spent 5.4 minutes at a software sponsor’s demo station, and that 25% of attendees returned for a second visit later in the day. These metrics tell a powerful story: not only how many people showed up, but how engaging the experience was. Sponsors often equate longer dwell times with higher quality engagement (attendees genuinely interested in the product). Some advanced systems even generate heat maps of attendee movement to prove how many people visited a sponsored area, highlighting which sponsor areas attracted the most traffic. By sharing metrics like “10,000 unique visitors logged at your booth, with an average dwell time of 7 minutes,” you provide sponsors tangible evidence that they had meaningful interactions, not just drive-by logo glances.
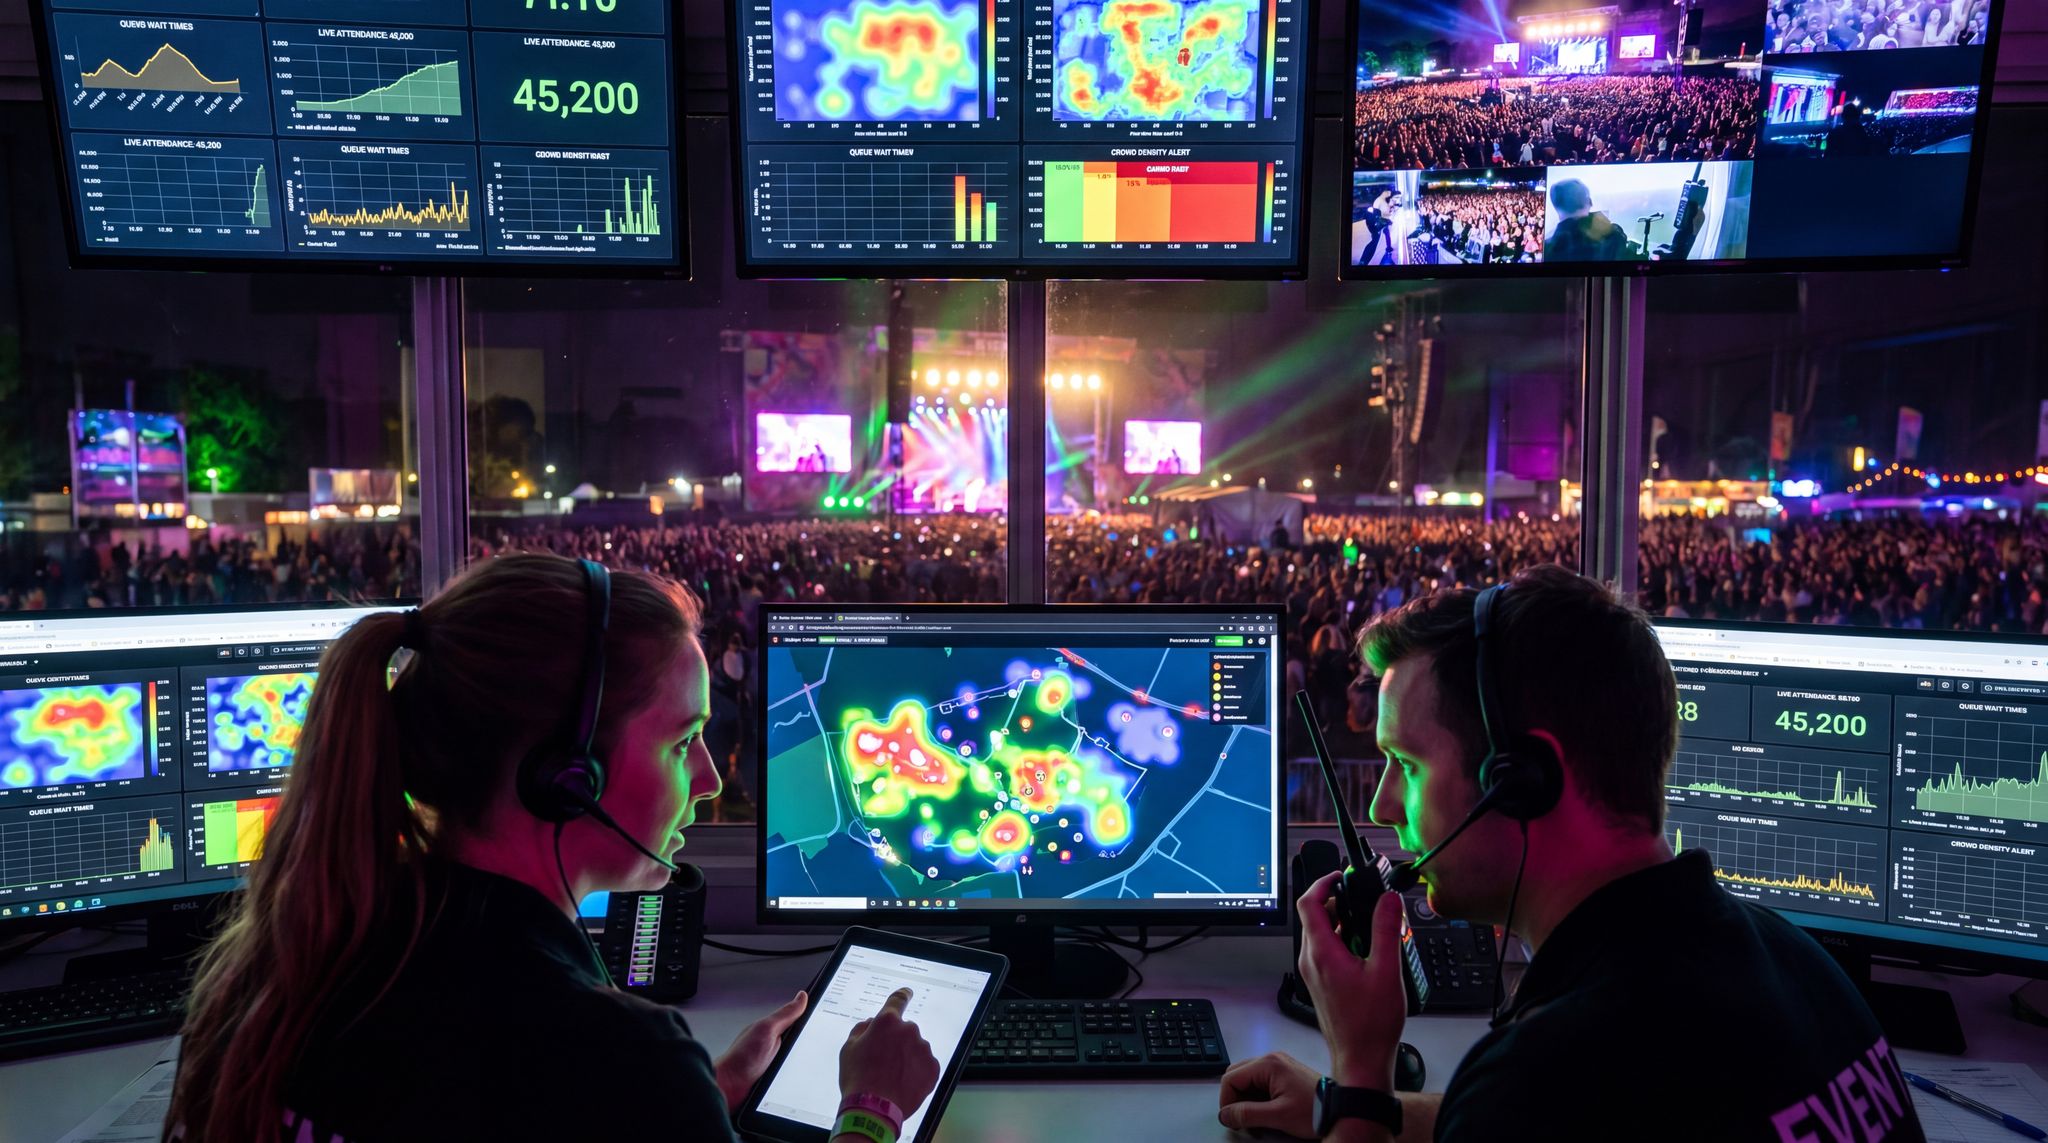
Real-Time Insights and Reactive Optimizations
RFID’s power isn’t limited to post-event reports – it can feed real-time dashboards during the event. Organizers can watch live counts of how many attendees are in each sponsor zone or which activations are busiest at the moment, allowing organizers to translate dashboards into concrete ROI. This enables on-the-fly optimizations to maximize ROI. If you see that a sponsor’s area has low foot traffic on Day 1, you can respond proactively: make stage announcements directing people there, send a push notification with an incentive (“Free swag at the XYZ Sponsor Tent now!”), or physically reposition a popular attraction nearer to that sponsor’s booth to match sponsor ROI expectations. One veteran sponsor manager described treating tech activations like a mixing board – tweaking in real time to ensure every sponsor gets the promised exposure, effectively applying learnings and adjustments in real-time. By event’s end, these reactive measures can significantly boost a lagging sponsor’s numbers, ensuring no partnership falls flat. Sponsors greatly appreciate this agile approach; it shows you are actively invested in their success, not just passively reporting outcomes later. Essentially, RFID and live analytics let you manage by data during the event to deliver on ROI commitments.
Ready to Sell Tickets?
Create professional event pages with built-in payment processing, marketing tools, and real-time analytics.
Leveraging Wearables Beyond Entry
RFID/NFC wearables first gained popularity for fast, secure entry and cashless payments, but in 2026 they’re multi-purpose tools for sponsor engagement. Smart wristbands and badges can be used in creative activations: for example, attendees might tap their wristband at various sponsor touchpoints to collect points or rewards in a scavenger hunt game. Each tap is logged – providing a count of engagements per sponsor – and attendees can see their progress on a leaderboard. These gamified interactions not only draw attendees to sponsor booths, they also yield rich data for ROI. An attendee who taps at all 10 sponsor checkpoints, for instance, has demonstrated a high level of engagement that sponsors will value. The technology has become robust enough that even if connectivity is an issue, many RFID systems offer offline caching – scans are stored locally and sync when back online, so no data is lost, ensuring tech-powered activations capture data reliably. With proper planning (e.g., ensuring strong Wi-Fi or cellular backups near sponsor areas), RFID activations run smoothly and collect 100% of intended data. Organizers should verify their RFID platform can integrate all these touchpoints into unified analytics. If managing multiple tech vendors (RFID for entry, a different system for on-site activations), be sure to integrate your technology stack so data flows seamlessly – a fragmented data approach will make it harder to prove ROI later.
Event App Analytics: Insights into Digital Engagement
In-App Sponsorship Opportunities and Metrics
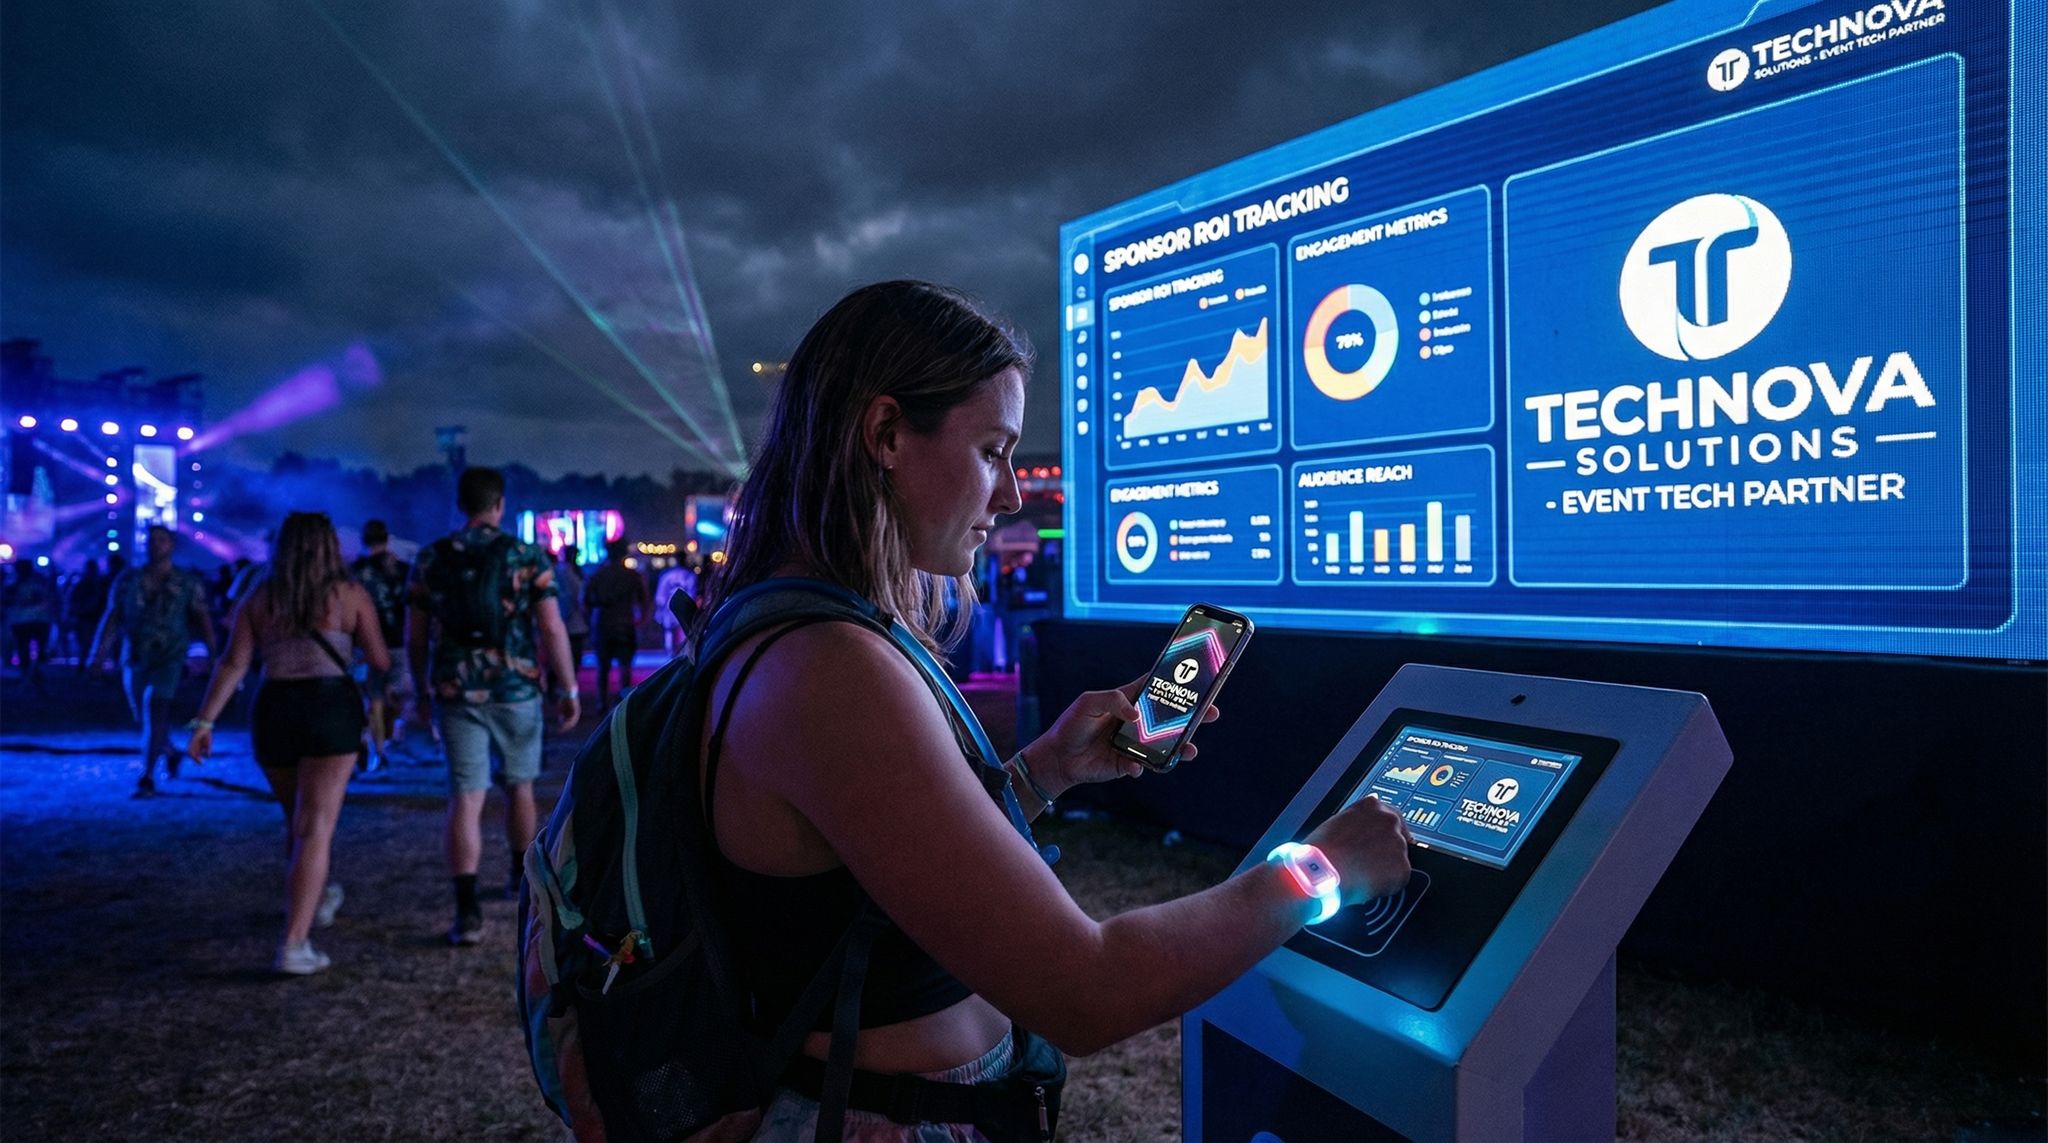
Mobile event apps have become a treasure trove of sponsor engagement data. Whether you use a dedicated native app or a progressive web app, these platforms typically offer multiple sponsor touchpoints: rotating banner ads, sponsored push notifications, exhibitor listings, interactive maps with sponsor logos, and more. Each of these can generate metrics. For example, an app might record 50,000 banner impressions for a headline sponsor’s logo, with a 2.5% click-through rate leading to 1,250 taps that open the sponsor’s page. On that page, you might track the average time spent (say, 45 seconds reading about the brand) and whether the user performed a secondary action like bookmarking the sponsor or redeeming a coupon code. These granular analytics – impressions, clicks, dwell time – mirror the kind of data sponsors get from digital marketing campaigns, focusing on measurable return on investment metrics. In 2026, many event apps also support embedded sponsor content (like videos or polls); you can report on how many views a sponsor’s video got or how many responses their poll question received. For instance, at a recent fintech conference, a banking sponsor included a poll in the app – “What financial goal are you most interested in?” – which got 3,200 responses, providing not just engagement but also valuable market data for the sponsor. When presenting ROI, these in-app metrics demonstrate active interest from the audience beyond physical booth visits.
Geo-Targeting and Location-Based Engagement
Advanced event apps leverage smartphone location services (GPS, Bluetooth beacons, or geo-fenced Wi-Fi) to enhance sponsor activations. With attendee permission, organizers can use location data to send geo-targeted sponsor messages – for example, a push notification that pings users when they near a sponsor’s booth (“You’re close to the Acme Corp VR Lounge – stop by for a free demo!”). The app analytics can then report how many users received the message and what percentage acted on it by visiting that area. At large festivals or trade shows, this can bridge the gap between digital and physical engagement, effectively linking app interactions to on-site RFID scans. Some apps even display an interactive venue map where sponsor areas are highlighted; by tracking map clicks or “get directions” taps to those areas, you gauge interest. Imagine being able to tell a sponsor, “1,500 attendees searched for your booth location in the app, and footfall counters logged 1,450 visits – a near-perfect conversion of digital interest to physical traffic.” This kind of insight is possible when app data and on-site data are combined. Ensure your app provider can export detailed engagement logs, or use integrated platforms (via SDKs or APIs) so that actions like scanning into a session, liking a sponsor’s post, or joining a sponsored session all feed into one analytics ecosystem, creating a unified framework for ROI reporting. The more unified the data, the more convincingly you can attribute on-site outcomes to multi-channel engagement.
For sprawling outdoor venues, this location-based data is particularly crucial. Promoters looking to track golf course marketing ROI or measure brand engagement across massive festival grounds rely heavily on these geo-fenced zones. By mapping out specific hospitality tents, sponsored holes, or VIP greens, organizers can show corporate partners exactly how much time attendees spent interacting with brand activations across a wide physical footprint.
Data-Driven Event Marketing
Track ticket sales, demographics, marketing ROI, and social reach in real time. Exportable reports give you the insights to make smarter decisions.
Personalization and Sponsor Value
One reason mobile apps are so powerful for ROI is personalization. Event apps often allow attendees to create profiles, set preferences, and schedule sessions – data which can be leveraged to give sponsors targeted opportunities. For example, a sponsor might want to reach attendees interested in a certain topic or demographic. Through the app, you could run a sponsored survey or content piece targeted to that segment and then show that “Out of 500 users who identified interest in sustainable living, 300 interacted with our eco-sponsor’s article, spending an average of 1.2 minutes on it.” This not only proves engagement but alignment with the sponsor’s target audience. Additionally, apps can track social sharing (e.g., if the app has an activity feed and attendees share sponsor-related posts or photos) and referrals (if the sponsor offers a referral deal via the app). All these micro-interactions add up. By the end of the event, you might present a sponsor with a rich tapestry of digital touchpoints: “You got 80,000 banner impressions, 5,200 clicks, 1,100 video views, 400 coupon redemptions through the app – and those led to 250 extra booth visits by people who showed the redeemed coupon in person.” It’s a comprehensive story of how the event’s digital layer amplified their reach. For organizers debating the investment in a dedicated app, consider that a well-designed event app in 2026 can double as a sponsorship ROI engine. If budget is a concern, even web-based event solutions can track many of these metrics; the key is ensuring you have analytics access to everything sponsor-related in the app or site.
Event Networking Platforms and B2B Matchmaking
For B2B conferences and trade shows, deploying event networking platforms that drive ROI for sponsors and exhibitors is a game-changer. These dedicated matchmaking tools go beyond basic app features by using AI to suggest relevant connections between attendees and sponsor representatives. When an exhibitor can see exactly how many pre-scheduled one-on-one meetings were facilitated through the platform, the value proposition becomes undeniable. Organizers can report on metrics like meeting acceptance rates, messages exchanged, and post-meeting ratings, ensuring sponsors receive high-intent conversations that directly feed their sales pipeline.
Grow Your Events
Leverage referral marketing, social sharing incentives, and audience insights to sell more tickets.
By integrating these matchmaking systems with your broader analytics suite, you can demonstrate how digital introductions translate into physical booth visits and closed deals, further solidifying the technological impact on your overall sponsorship measurement strategy.
As we look toward the future of B2B gatherings, evaluating the best event networking platforms for sponsors and exhibitors to maximize ROI in 2025 and 2026 requires prioritizing tools with robust API ecosystems. The top-tier solutions now feature predictive matchmaking algorithms and automated lead scoring, ensuring that every digital handshake translates into a quantifiable business opportunity for your partners.
When organizers ask how to select an event networking platform that actually drives ROI for sponsors and exhibitors, the answer lies in systems that bridge the gap between virtual introductions and on-site conversions. The most effective B2B matchmaking apps provide dedicated sponsor dashboards, allowing brand representatives to monitor meeting acceptance rates, track pipeline velocity, and export qualified leads directly into their own CRM systems.
Specialized Tracking for Esports and Hybrid Events
When it comes to measuring ROI on esports event sponsorship deals, organizers must blend physical venue data with massive digital broadcast metrics. Competitive gaming tournaments often feature hybrid audiences, meaning a sponsor’s logo might be seen by 5,000 fans in the arena and 500,000 viewers on Twitch or YouTube. To accurately capture this value, promoters integrate streaming analytics—such as concurrent viewership, chat mentions, and on-screen logo exposure time—with on-site app engagement and RFID booth visits. By consolidating these dual data streams, esports organizers can present brands with a comprehensive valuation that reflects both the hyper-engaged local crowd and the expansive global digital reach.
Go Cashless With RFID Technology
Enable contactless payments, faster entry, and real-time spending analytics with RFID wristbands and NFC-enabled ticketing for your events.
Interactive Digital Signage and On-Site Tech
Smart Signage: From Impressions to Interactions
On-site digital signage has evolved far beyond static slideshows – today’s LED walls and interactive screens can actively measure audience engagement. For example, many events now use motion sensors or cameras on digital billboards to estimate viewer count and dwell time. A sponsor’s ad displayed on a screen in the convention center lobby might report that “10,000 people walked past today, with an average view time of 3 seconds.” While not every event has retina-tracking tech, even basic approaches like QR codes on signage can provide metrics. If a sponsor’s poster or digital screen includes a QR code for a special offer, you can count exactly how many scans it received (and even how many conversions if that QR leads to a sign-up or website). Touchscreens and kiosks offer even richer data: suppose an auto sponsor sets up a touchscreen “Design Your Dream Car” kiosk. The system can log how many people used it, how long they spent on it, and what options they interacted with. Perhaps 500 attendees spent an average of 2 minutes each customizing cars, and 120 of them entered their email to receive a copy of their design. Those numbers translate directly into ROI talking points (e.g. “500 deep engagements, 120 leads”). Interactive digital signage essentially turns what used to be a passive branding medium into an experiential medium that generates data. By 2026, even mid-sized events can rent or deploy relatively affordable interactive displays or partner with sponsors to bring them. The key is to plan from the start how the engagement will be measured – ensure the signage software or connected devices are set to capture counts or integrate with your analytics platform.
Augmented Reality Overlays and Gamified Displays
Augmented Reality is no longer just a buzzword at events – it’s becoming a practical tool to drive sponsor engagement. Using attendees’ smartphones (often via the event app) or AR glasses, events can overlay digital content onto the physical venue. For example, a music festival app might have an AR treasure hunt where attendees point their phone cameras at various landmarks to reveal hidden AR objects or clues, creating an environment where fans collect digital badges. These objects could be branded – e.g., finding the AR mascot of a sponsor. The app logs every interaction: how many people launched the AR feature, how many AR objects they found, etc. If 2,000 attendees participate in an AR scavenger hunt presented by Sponsor X, collectively generating 15,000 AR interactions, that’s gold in an ROI report. One real-world example is a golf tournament that introduced a sponsor-backed AR experience: fans hunted virtual objects around the course for prizes, leading to massive brand exposure for the sponsor, driving millions of fan engagements. AR activations turn what might have been a simple booth visit into a memorable adventure, all while quietly logging each interaction compared to traditional lead capture methods. Importantly, AR also tends to create social media moments – attendees often share photos or videos of the cool AR visuals, further extending a sponsor’s reach (more on measuring that later). When pitching AR to sponsors, emphasize that every AR scan or game play is measured and can be reported, addressing any skepticism about AR’s tangible benefits.
Live Screens and Real-Time Sponsor Recognition
Events in 2026 can also leverage their big screens and stages for interactive, measurable sponsorship shout-outs. Live polling or quiz segments displayed on LED walls (e.g., a “Trivia Question of the Hour presented by [Sponsor]”) can show immediate engagement numbers. If 5,000 attendees out of 8,000 respond to a live poll question via the event app or text, that’s a 62.5% engagement rate that you attribute in part to the sponsor’s activation. Similarly, many conferences run social media walls – big displays of attendee posts – often sponsored by a tech partner. Those systems log how many posts are made with the event hashtag and can filter how many mentioned the sponsor. For instance, “Our social wall, sponsored by Acme Corp, showcased 1,200 attendee posts, and the Acme brand was mentioned in 250 of them.” Additionally, consider NFC touchpoints around digital signage: an interactive poster might say “Tap your phone here for a surprise from [Sponsor].” Modern smartphones can trigger a web link via NFC; you then track how many taps occurred and how many attendees followed through on the subsequent action (like filling a short form to win a prize). Each of these on-site technologies – AR, touchscreens, NFC posters, live polls – generates engagement data in real time. Savvy organizers set up an operations center of sorts, monitoring these feeds so they know which sponsor activations are hitting the mark. When a particular interactive display gets swamped with participants, that’s a highlight to mention to the sponsor right away (“The AR photo booth you sponsored has a constant queue – it’s a hit!”). On the flip side, if an interactive element isn’t drawing attention, you can adjust on Day 2 by promoting it more. The endgame is a suite of interactive touchpoints that not only delight attendees but also output the metrics that prove to sponsors how deeply attendees engaged with their brand.
Gamification and Immersive Sponsor Activations
Gamified Challenges and Sponsor Quests
Gamification has emerged as a potent strategy for sponsor activations – it combines fun for attendees with rich data for sponsors. Many events create games or challenges that encourage participants to engage with multiple sponsor touchpoints. For example, a trade show might implement a scavenger hunt where attendees earn a stamp or scan for each sponsor booth they visit; completing the hunt could enter them into a grand prize draw. Using RFID or QR code scans at each station, organizers capture exactly how many people visited each sponsor (and who visited all vs. just a few). Completion rates are a telling metric: if 1,000 attendees started the hunt and 600 completed all tasks (e.g., visiting all 10 sponsor booths), that 60% completion shows strong overall engagement. Better yet, the data can show which sponsor station had the most drop-offs. Perhaps only 700 made it to Sponsor #7’s booth – indicating some fatigue or lower interest at that point – which is valuable feedback for all parties. Weaving sponsors into a unified game spreads attention more evenly and incentivizes attendees to interact willingly (the psychology of earning a reward). One caution: ensure the game mechanics serve the event’s goals. A festival-wide mission should match the vibe – e.g., at a comic-con, finding AR superheroes fits well, helping ensure the experience feels authentic, while at a food festival a “ingredient hunt” from sponsor to sponsor might work. The data from gamification isn’t just how many played, but how it drove behavior: increased foot traffic (which you can attribute to the game), cross-pollination (attendees who might’ve skipped a booth visited because of the game), and content collection (players often gladly give email/phone info to join or redeem prizes). All of this funnels into sponsor ROI metrics.
AR and VR Experiences with Data Capture
Alongside games, Augmented Reality (AR) and Virtual Reality (VR) activations provide immersive experiences that double as data captures. AR we discussed with treasure hunts; VR often comes into play with sponsors providing a unique experience (like a VR sports simulator or a virtual tour). The critical practice is to integrate lead capture or tracking into these experiences. Today, instead of a freeform “try this VR demo,” events use tactics like requiring a quick scan of the attendee’s badge or app QR code before entering the VR booth. That simple step means you log each participant (and collect their info for the sponsor). Suppose a car manufacturer sponsors a VR test drive experience at a expo: 300 people try it, and each one’s contact info is captured going in. Now the sponsor has 300 leads who showed interest in their cars, which is immensely valuable compared to just counting eyeballs on a sign. In fact, lead capture is often the holy grail of sponsorship ROI, utilizing QR codes that make lead collection seamless. Modern tech has revolutionized this process – rather than fishbowls of business cards, we have smart badges and apps to scan in attendees seamlessly, leveraging tech-powered strategies to maximize ROI. Even AR games can prompt users to input contact details to claim prizes or see their score on a leaderboard, seamlessly tying into lead capture. The key is to make it part of the fun: for instance, an AR trivia game could require an email to save your high score. VR demos might feed into a follow-up survey (“Rate your experience for a chance to win a full product”). By carefully planning these interactions, every AR/VR activation becomes a two-way exchange: the attendee gets a cool experience, and the sponsor gets data or a lead. It’s a textbook win-win that turns immersive tech into something you can quantify. One successful example: at a major trade show, a sponsor ran a VR cycling challenge (attendees rode a stationary bike with a VR headset through a virtual landscape). Over 1,000 people participated, and 1 in 3 opted in to share their contact info for contest entry. Those ~333 qualified leads plus the buzz generated (often attendees watching and posting about others doing the VR challenge) provided clear ROI justification for the sponsor’s significant investment in that activation.
Converting Engagement into Measurable Outcomes
Engagement for its own sake is nice, but sponsors ultimately want to see that engagement translate into outcomes like brand awareness lift, lead generation, or sales pipeline. That means as an organizer you should be prepared to map fun interactions to business metrics. For example, if your gamified activation with RFID taps reports “8,000 total taps from 2,000 participants,” break that down in the sponsor report: “This equals 4 taps per participant on average, indicating multiple interactions with your brand, and 45% of all attendees engaged with your activation.” If the sponsor’s goal was awareness, highlight the reach (portion of attendees). If their goal was leads, highlight the number of contacts collected or contest entries. To make it tangible, it’s effective to connect the dots to potential revenue. Let’s say 300 attendees scanned at Sponsor X’s booth and 120 provided contact info. If Sponsor X’s average customer value is £4,000 and even 5% of those leads convert, that’s roughly £24,000 in future revenue attributable to the event, establishing clear benchmarks for lead value. Framing it this way helps sponsors see a concrete return in financial terms, not just vanity metrics. You can also assign media value to engagements: e.g., “Your sponsored game generated 10,000 minutes of total engagement – equivalent to nearly 170 hours of focused brand interaction. Compare that to 170 hours of online ads and you’d have spent £X for that many impressions.” Some organizers use benchmarks like “each booth visit is worth Y in ad spend” by comparing to trade show lead costs or CPM rates, proving revenue growth beyond ticket sales. While such estimates should be conservative, they translate engagement into currency which many sponsors’ marketing teams will appreciate. Ultimately, by converting engagement stats into the language of business outcomes, you help sponsors internally justify the partnership and get excited about repeating it.
Consolidating Data and Analytics for Sponsors
Integrating Multiple Data Streams
With so many tech touchpoints – RFID scanners, mobile app analytics, social media feeds, AR game dashboards, etc. – one of the big challenges is consolidation. Sponsors don’t want five separate spreadsheets; they want a cohesive view of their impact. Smart events in 2026 invest in building a cohesive technology stack that connects ticketing, access control, apps, and other systems. This often means using platforms that natively integrate or employing middleware (like a CRM or data warehouse) to gather data from each source. For instance, you might feed RFID scan data, app click data, and social mentions all into a tool like Google Data Studio or an event analytics dashboard. The goal is to be able to query and cross-filter the data easily: e.g., pull up how many people who used the event app also visited Sponsor Y’s booth – linking digital and physical engagement for deeper insights. Many ticketing and registration platforms now offer open APIs and webhooks that make integration easier, so insist that your vendors support data export in real time. If your event uses the Ticket Fairy platform, for example, you benefit from full data ownership and API access to customer engagement information, allowing you to pipe those insights into custom reports. However you do it, ensure from the outset that data schemas align – consistent timestamp formats, attendee IDs, sponsor IDs across systems – so that merging doesn’t become a nightmare. Doing this groundwork enables the holy grail: a unified sponsor ROI dashboard covering all metrics in one place, simplifying the search for ROI data. This not only simplifies reporting but also helps you spot correlations (did push notifications increase booth visits? did longer session dwell times correlate with more sponsor page clicks?). Integrated data turns disjointed metrics into a narrative.
Understanding the full event tech impact on ROI tracking and analytics requires this holistic approach. When your ticketing, access control, and engagement apps speak the same language, you transform raw, disjointed numbers into a compelling, undeniable narrative of sponsor value.
When stakeholders ask about the broader influence of event technology on sponsorship measurement, the answer lies in this seamless data integration. It eliminates the guesswork from post-event reporting, allowing promoters and venue operators to present brands with a unified dashboard that correlates digital interactions—like app banner clicks—directly with physical booth visits and lead capture conversions.
Real-Time Monitoring and Mid-Event Adjustments
We touched on real-time RFID monitoring; broadly, having an integrated feed of key metrics during the event allows the organizer to be a data-driven conductor of the attendee experience. Ideally, set up a “war room” or at least a laptop with dashboards showing live stats: number of entries, app engagement, current booth counts via people counters, etc. Some events configure alerts – e.g., if a sponsor booth’s entry scans drop below a certain rate per hour, a notification prompts the team to take action (perhaps send a roving entertainer to that area, or mention it on stage). This kind of responsive approach can salvage ROI in real time, treating tech activations as dynamic tools. It’s far better to address an issue on Saturday afternoon than to explain it after the fact in a report (“Sorry, I guess attendees just weren’t interested”). In one case, a festival noticed via Wi-Fi analytics that the VIP lounge (sponsored by a beverage company) was under-visited on Day 1. They discovered signage was unclear; on Day 2 they added large banners and had staff actively invite premium ticket-holders. The result was a doubling of VIP lounge traffic – something the sponsor definitely noticed and appreciated. The lesson: use your tech tools not only to measure but to actively manage and optimize the event as it unfolds. By keeping sponsors’ goals in mind and watching the data, you can often hit targets that you’d otherwise miss. And be sure to log these interventions; it makes a great story in post-event meetings to say, “We saw mid-event that your footprint was a bit low, so we did X, Y, Z and brought you up to the expected numbers.” That shows sponsors that you are proactively committed to their success.
Stepping into this active management role means acting as the ultimate conductor proving the ROI in real time. By orchestrating attendee flow and digital touchpoints on the fly, you ensure that every brand partner achieves their specific engagement goals before the venue doors even close.
Post-Event Data Cleaning and Analysis
Once the event is over, it’s time to crunch the numbers with rigor. First, audit and clean the data from all sources. Ensure, for example, that any duplicate scans (say an attendee rapidly tapping an RFID reader) are filtered out so they don’t overcount. If you have registration data tied in, you might enrich the engagement stats with attendee demographics – perhaps noting that “45% of those who visited Sponsor A’s activation were VIP ticket holders” or whatever breakdown is useful. Look for patterns and insights: did one sponsor activation wildly outperform others? Did certain times of day see spikes in engagement? These can be turned into recommendations (“Next time, we’ll schedule your sponsored session in the morning slot, since we saw that’s when most of the target attendees were active in the app.”). If your event had multiple sponsors, you might also anonymize and benchmark some metrics to provide context – e.g., “The average booth at our expo saw 800 visits, while your booth attracted 1,150 – 43% above average.” Be careful with privacy and promises; if you said you wouldn’t share specifics across sponsors, stick to that. But industry benchmarks or anonymized comparisons can add weight to results. Many large events use visual analytics tools to create charts and heatmaps: a bar graph of top 5 most visited sponsor activations, a heat map of the expo floor by foot traffic, a funnel diagram of app impressions to clicks to leads for a sponsor. Visuals make the data digestible and impactful for the sponsor (and for their higher-ups who might skim the report). Finally, validate the numbers by cross-checking multiple sources where possible (e.g., your RFID count of booth visits vs. the sponsor’s own on-site tally, if they had one). Consistency builds trust in the data. If there are discrepancies, be upfront and explain them. The result of this analysis phase should be a comprehensive story of performance, ready to be packaged into a report.
Smooth Entry With Mobile Check-In
Scan tickets and manage entry with our mobile check-in app. Supports photo ID verification, real-time capacity tracking, and multi-gate coordination.
Unified Sponsor ROI Dashboard & Reports
Delivering the data to sponsors can range from a simple PDF report to an interactive online dashboard. For major sponsors or long-term partners, consider providing a live dashboard where they can explore the metrics themselves. Some events give sponsors a login to view their data in near real-time (filtered to only their assets), which can be a selling point. But at minimum, prepare a polished post-event report. Start with an executive summary: a concise recap of key achievements (e.g., “150k brand impressions, 18k direct engagements, 2.1k leads captured”). Then break down into sections by engagement type: on-site engagement, digital engagement, social/media reach, lead generation, and any sponsor-specific objectives. Use tables and charts to highlight results against goals. For instance:
| Sponsor Activation | Engagement Metric | Result |
|---|---|---|
| RFID Booth Visits | Unique attendees who visited booth | 1,450 (36% of event audience) |
| Average Dwell Time | Time spent per person at booth | 5 minutes 22 seconds |
| App Banner Clicks | Click-throughs to sponsor page | 1,200 clicks (2.4% CTR) |
| Leads Captured | Email addresses collected on-site | 380 qualified leads |
| Social Media Hashtag Usage | Posts by attendees with sponsor tag | 210 posts (reach ~75,000) |
(Table: Example sponsor ROI metrics from event)
Such a table gives a snapshot of value across channels. In the narrative, tie each metric to interpretation: “1,450 booth visits means roughly a third of all attendees engaged with your brand in person. 380 leads were captured for your sales team to follow up – representing potential pipeline value. The social posts mentioning your brand reached an estimated 75k people online, extending awareness beyond the venue.” Where possible, compare results to initial targets set with the sponsor, or to past events: “Our goal was 1,000 booth visits; we achieved 145% of that target.” This shows you take their objectives seriously. Also include any qualitative feedback that adds color – e.g., quotes from attendee surveys like “I loved the XYZ sponsor’s VR game, it was a highlight!” or a note that the sponsor’s activation was voted most popular in a post-event poll. These anecdotes underscore that the sponsor not only got numbers, but also goodwill and positive exposure.
Key Metrics that Demonstrate Sponsor Impact
Impressions vs. Engagement vs. Conversions
It’s important to distinguish different levels of metrics when proving ROI. Impressions are the broadest – counts of how many times an attendee could have seen the sponsor’s branding (e.g., banner views, number of attendees who got a flyer, etc.). This is akin to advertising reach and is useful for awareness goals. Engagement metrics go deeper, reflecting active participation: booth visits, app clicks, contest entries, poll responses – whenever an attendee actively interacts with the sponsor’s content or activation. Sponsors increasingly prioritize engagement metrics because they show genuine interest, not just passive exposure, as companies scrutinize every partnership for value. Finally, conversions or outcomes are the most tangible: leads generated, on-site sales, post-event purchases traced back to the event, or other actions that tie to the sponsor’s bottom line. For example, if the sponsor was selling product at their booth, the total sales or samples distributed would be a direct outcome metric. In 2026, forward-thinking sponsors and organizers set specific KPIs across all three tiers: e.g., 100k impressions, 10k engagements, 500 leads (conversions). It’s wise to report on each tier in context, rather than just one number. A sponsor might have millions of impressions but only a few hundred engagements – which tells a different story than lower impressions but very high engagement. By breaking metrics into these categories, you ensure the sponsor sees the full funnel of value: broad reach (awareness), interactive interest (engagement), and concrete results (conversion).
Dwell Time and Quality of Interaction
All engagements are not equal – quality matters. Dwell time (how long someone spends with a sponsor’s content) is a proxy for quality. For instance, two attendees might both visit a sponsor booth (counted as two engagements), but if one left after 5 seconds and the other stayed for 5 minutes, the latter was clearly more meaningful. Whenever possible, track and report time-based metrics. This could be average booth dwell time (via RFID or manual timing), average session duration in a sponsored virtual event, or video watch time for sponsored content. High dwell times suggest the sponsor effectively captured attention. Similarly, repeat engagement is a quality indicator: if 500 attendees visited a booth but 100 of them came back again later, that’s a strong sign of continued interest. Highlight such stats: “20% of visitors to your activation returned for at least a second interaction.” Another measure is depth of engagement – for example, in an app, maybe an attendee not only clicked a sponsor’s banner but also spent time on their page and then requested info. Each additional step they take indicates higher intent or interest. These compound interactions can be assigned a simple score or tier (e.g., Bronze = saw it, Silver = engaged once, Gold = engaged multiple ways). Some events create engagement scores for sponsors, combining different metrics into one index, which can simplify year-over-year comparison. However, be transparent about how any scoring is calculated. Ultimately, by focusing on quality indicators like time and repeat actions, you move the conversation from “We reached a lot of people” to “We genuinely connected with people – here’s the proof.” That is far more compelling when a sponsor evaluates ROI.
Social Media Reach and Share of Voice
Beyond the confines of the event itself, sponsors want to know if their involvement reverberated through social and media channels. Social media reach has become a standard part of ROI reporting. Track all event-related posts, and specifically those that mention or feature the sponsor. Many events will have an official hashtag; you can use social listening tools or even manual analysis to count how many times the sponsor was tagged or talked about by attendees. For example, “Attendees made 2,500 posts with our event hashtag, and 300 of those posts (12%) included your brand name or campaign hashtag, reaching an estimated 880,000 users on Instagram/Twitter/etc.” Providing that kind of data shows the amplified exposure the sponsor got through attendee word-of-mouth. If you have influencer partnerships or media coverage tied to the sponsor, include metrics on those (TV impressions, article readership estimates, etc.). Some sponsors may also look at Share of Voice – basically, out of all branded content around the event, how much was theirs vs. other sponsors or partners. If your post-event analysis finds that the sponsor’s branding accounted for 30% of all sponsor-mentions online, that’s a strong showing. There are services that can benchmark sponsorship media value by analyzing logos in photos and streams (common in sports). If available, these can translate on-screen logo time into advertising dollar equivalents. But for most events, simple social metrics and any earned media highlights will do. Don’t forget sentiment: if you have attendee feedback or social sentiment analysis indicating positive reactions to the sponsor activation, mention it. E.g., “95% of comments about the [Sponsor] lounge were positive.” This qualitative angle reinforces that the sponsor’s presence was not only visible but valuable to the audience, enhancing their experience.
Turn Fans Into Your Marketing Team
Ticket Fairy's built-in referral rewards system incentivizes attendees to share your event, delivering 15-25% sales boosts and 30x ROI vs paid ads.
Conversions: Leads, Sales, and Beyond
At the end of the day, many sponsors will judge success by the conversions – did this event sponsorship help us win business or achieve a concrete goal? If the sponsor’s goal was lead generation, the number of leads and their quality (if discernible) is paramount. We’ve discussed counting leads captured on-site or via app. A best practice is to follow the journey beyond the event: track if possible which leads turned into opportunities or sales for the sponsor. Sometimes the sponsor will share this back with you later. Even if only anecdotally, it’s powerful to include: “Of the 380 leads collected, your team reported 40 qualified opportunities and 5 closed deals within 3 months, directly attributing ~$60,000 in new business to the event.” Not every sponsor will give you that info, but encourage a two-way discussion post-event to get it. If the sponsor was more about on-site sales or redemptions (e.g., a food & beverage sponsor giving samples that later should boost retail sales), find metrics to correlate. Perhaps you distributed 5,000 free drink coupons at the event and the sponsor informs you that 1,500 were redeemed at their stores (30% conversion) – that’s a very tangible ROI metric to report. For consumer brands, sometimes ROI is measured in purchase intent or brand affinity uplift. In that case, survey data might come into play: you could run a brief post-event survey asking attendees questions like “Which sponsor do you remember? Did your perception of [Sponsor] improve after the event?” If 78% of respondents say they’re more likely to consider the sponsor’s product, that’s a soft conversion metric indicating future sales potential. In 2026, some events are also tying in promo codes or affiliate links for e-commerce. For example, a fashion sponsor might give attendees a 20% off code, and later you can report how many used it to buy products online. All these conversion metrics close the loop from engagement to financial impact. They’re the hardest data to get but also the most convincing. Even one clear success story (like that sponsor who closed $30k of business from event leads) can justify the entire sponsorship in the sponsor’s eyes.
If you are evaluating the best way to track sponsor ROI through ticket sales, consider utilizing unique sponsor-specific affiliate links or promo codes during the registration phase. This strategy allows you to definitively prove how many attendees a specific brand partner drove to your event, adding a direct revenue-generation metric to their overall performance report.
Beyond simple promo codes, the most sophisticated approaches to tracking sponsorship impact on ticketing involve deep API integrations between your registration platform and the sponsor’s CRM. By setting up custom UTM parameters and dedicated landing pages for each brand partner, organizers can monitor the entire conversion funnel. This allows you to see not just how many tickets were sold, but the specific attendee demographics driven by that sponsor’s marketing efforts, providing a highly granular view of the partnership’s direct financial return.
Implementing a Sponsor ROI Measurement Plan
Setting Goals and KPIs with Sponsors
Proving ROI starts well before the event – in the planning and pitching stage. It’s crucial to sit down with each major sponsor and ask, “What does success look like for you?” Identify their primary objectives: is it broad brand awareness (maximizing impressions), deep engagement (lots of interaction with a new product), lead generation, direct sales, or something else like content generation or CSR impact? Once you know this, mutually agree on Key Performance Indicators (KPIs) that you will measure and report. For instance, if a sponsor’s goal is 10,000 product samples distributed, then “# of samples given” becomes a KPI and you’ll arrange a way to count it (handheld tally counters at each sampling station, or using RFID if samples require a scan). If the goal is brand awareness among a niche audience, a KPI might be “attendee recall rate” – measured via a post-event survey question asking if they remember the sponsor. By establishing KPIs upfront, you also demonstrate to the sponsor that you’re serious about data. Many savvy sponsors now even include an “ROI measurement & reporting” section in the sponsorship agreement, requiring organizers to prove them with measurable data. For example, the contract might list that the organizer will provide metrics A, B, C by X date post-event, ensuring transparency through shared reporting. This holds both parties accountable. In practice, create a simple one-page Sponsorship Metrics Plan for each sponsor, listing goals and how each will be measured. Not only does this guide your technology implementation (ensuring you have the tools in place to capture each metric), it also helps manage expectations. If a sponsor has an unrealistic goal (“We want 100% of attendees to visit our booth”), you can discuss it and perhaps adjust the activation or goal to be feasible. Aligning on KPIs ensures that when you deliver the report, there are no surprises – just a clear demonstration of the metrics you all cared about from the start.
When defining your sponsorship KPIs, it helps to categorize them into three distinct buckets: brand visibility, active engagement, and direct conversion. A well-rounded KPI sponsorship framework ensures that both top-of-funnel awareness and bottom-of-funnel sales are tracked. For instance, visibility KPIs might include total digital impressions and physical footfall near branded zones. Engagement KPIs dive deeper, measuring average dwell time, app session duration, or the number of gamified interactions completed. Finally, conversion-focused sponsorship key performance indicators track the ultimate business value, such as qualified leads captured, promo codes redeemed, or direct sales attributed to the event. By structuring your measurement plan around these specific KPI categories, organizers can provide a comprehensive, multi-layered view of partnership success.
To ensure every event sponsorship KPI is actionable, organizers should establish historical baselines before the festival or conference begins. If a brand partner wants to measure lead generation, knowing your venue’s average conversion rate from previous years provides a realistic benchmark. This context transforms a raw metric into a meaningful performance indicator, allowing promoters to confidently demonstrate whether a specific activation overperformed relative to standard baseline expectations.
Smart Promo Codes & Presale Access
Create percentage or flat-rate discount codes with usage limits, date ranges, and ticket type restrictions. Plus unlock codes for private presales.
Choosing the Right Tech Toolkit
With KPI needs defined, choose the technology solutions that will capture the necessary data. This often means a mix of tools, as we’ve explored. If physical engagement metrics are key, invest in RFID/NFC systems or people counters. If app engagement is critical, ensure your event app has robust analytics or select an app platform known for its sponsor features. For lead capture, decide between methods like scanning badges (you might need rentable lead retrieval devices or a lead capture app for sponsors) versus digital forms or QR codes. Here’s a quick tech matrix aligning common sponsor goals to tools:
| Sponsor Goal | Relevant Tech Tools | Metrics Captured |
|---|---|---|
| Maximize booth traffic | RFID/NFC entry tracking; Wi-Fi tracking | Unique visitors, total visits, peak times |
| Deep attendee engagement | Interactive kiosks; AR/VR activations; App content | Dwell time, interactions per attendee, repeats |
| Lead generation | Badge scanning apps; QR code forms; Smart badges | Number of leads, conversion rate (to leads) |
| Brand awareness (on-site) | Digital signage analytics; AR games; Photo backdrops | Impressions count, participation rate, photos taken/shared |
| Social media impact | Social media walls; Official hashtags & monitoring | Post count, reach, engagement on posts |
| On-site sales/transactions | Cashless payment system; POS data | Sales volume, transaction count, uplift vs. avg |
(Table: Aligning sponsor goals with tech tools and measurable metrics.)
Notice that some tools are dual-purpose. RFID wristbands, for example, not only track traffic but can also be used for cashless payments – if a sponsor is a beverage vendor, the same system that logs entry can track how many drinks were purchased with RFID cashless credits, holding the event accountable for its performance. Choose integrated solutions where possible to reduce complexity. It’s also crucial to ensure any chosen tool can output data in usable formats. Fancy onsite tech is of little use if after the event you can’t extract the numbers. During vendor selection, ask about reporting: Does the system provide a dashboard or raw data export? Is it real-time? Can it segregate data by sponsor or activation? For instance, an RFID system should allow you to tag certain checkpoints as “Sponsor X’s booth” and then easily pull stats for that checkpoint. If not, you’ll be stuck manually filtering. Sometimes the best approach is to work with experienced partners: RFID providers like Intellitix or Wristrack (for example) have done hundreds of events and can advise on optimal reader placement and data capture specifically to satisfy sponsors. Similarly, for event apps, platforms like Whova or Cvent often have built-in sponsorship analytics modules. Make a checklist of all data points you promised or anticipate (visitor counts, clicks, leads, etc.) and confirm a tool or method for each one. If there’s something hard to measure (e.g., “attendee smiles” – hopefully no sponsor asks that!), discuss a proxy or drop it from the promise. In 2026 there’s a tech solution for almost every metric, but integration and reliability vary – choose a stack that is proven, interoperable, and scalable to your event size.
Ultimately, selecting platforms that provide detailed analytics on booth visits, banner ad clicks, and session attendance is what separates top-tier festivals and B2B conferences from the rest. By investing in a comprehensive event management ecosystem, organizers empower their sales teams to confidently prove ROI to sponsors, securing higher-tier renewals and long-term brand partnerships.
For organizers focused on experiential marketing and branded activations, utilizing tools like Splash event management software can significantly streamline how you measure sponsor ROI. These platforms excel at capturing guest data across multiple touchpoints—from initial RSVP to on-site check-in—allowing you to present sponsors with a unified dashboard of attendee engagement and conversion metrics.
Comparing the Accuracy of ROI Tracking Tools
When evaluating the best sports sponsorship ROI tracking tools, an accuracy comparison is essential, especially in high-capacity arenas or stadium environments where crowd density can skew data. Different technologies offer varying levels of precision. RFID and NFC wearables generally provide the highest accuracy (often 98-100%) for direct engagements, as they require an intentional physical tap by the attendee. Bluetooth beacons and Wi-Fi tracking are excellent for measuring passive dwell time and general foot traffic around a concourse activation, but their accuracy can fluctuate (typically 80-90%) depending on signal interference and whether attendees have their device’s Wi-Fi enabled. Meanwhile, advanced computer vision and AI camera systems are emerging as powerful tools for sports sponsorships, capable of tracking logo exposure and crowd sentiment with increasing precision, though they require significant calibration to match the deterministic accuracy of a direct RFID scan. For venue operators, the most reliable approach is layering these systems—using Wi-Fi for broad traffic trends and RFID for concrete, verifiable lead capture.
Grow Your Social Following With Every Sale
Require social media follows, shares, or playlist adds to unlock presale access or special pricing. Turn every ticket purchase into audience growth.
Training Staff and Testing Systems
Even the best technology can fail to deliver ROI proof if staff use it incorrectly or if it’s not tested in realistic conditions. Training event staff and volunteers on new tech is an often overlooked yet critical step to smooth data collection, especially when deploying new apps or games. For instance, if you’re deploying handheld badge scanners at sponsor booths for lead capture, ensure the staff operating them (whether your team or sponsor’s team) know how to use them, and why they’re using them. Emphasize to everyone: “If it isn’t scanned, it didn’t count.” Sometimes sponsors bring their own activation staff – include them in training communications or have a cheat-sheet at their booth. Leading up to the event, conduct a full test of each system in as close to real conditions as possible. That means having a mini “mock event” where you have people walk through RFID gates, tap at a demo sponsor booth, use the app to click a sponsor banner, etc., to see that data is indeed being captured and correctly attributed. Test how data flows to your dashboards. If you notice, for example, that the app’s timezone is off and clicks are not aligning with local time, fix it pre-event so you’re not dealing with confusion later. Also test for load and interference: RFID and Wi-Fi can interfere with each other if not properly managed, so start your audit by examining systems. Work with tech providers to coordinate frequencies (ensure your RFID is on a stable frequency band and not getting drowned out by other wireless devices) as part of reviewing RFID and NFC access control systems. If using mobile devices for scanning or AR, verify they have connectivity or offline modes in the venues’ environment (concrete expo halls can be notorious dead zones). Essentially, kick every tire. It can help to create an event tech checklist or timeline, for example:
| Timeframe | Milestone | Actions |
|---|---|---|
| 3+ months out | Sponsor KPI Planning & Tech Selection | Finalize metrics with sponsors; choose vendors for RFID, app, etc. |
| 1-2 months out | Integration Setup | Configure systems (RFID readers mapped, app content set); set up data flows/APIs |
| 2-4 weeks out | Staff Training & Tech Testing | Train team & sponsors’ staff on devices and tools; run on-site simulations |
| 1 week out | Final Systems Check | Double-check hardware setup (cables, power, internet); backup plans ready |
| During event (daily) | Live Monitoring & Adjustments | Track dashboards; troubleshoot issues; optimize low-engagement areas |
| 1-2 weeks post-event | Data Analysis & Report Compilation | Aggregate all data; analyze against KPIs; prepare visual report |
| Post-report follow-up | Review with Sponsor & Feedback | Walk sponsor through results; gather their input for next time |
(Table: Timeline for implementing sponsor ROI tracking and reporting.)
Following a structured timeline like this ensures that proving ROI isn’t an afterthought – it’s baked into your entire event lifecycle. By event day, everyone involved should know their role in capturing the promised data. And by testing tech thoroughly, you reduce the chance of nasty surprises (like finding out after the event that half the scans didn’t record due to a server issue). Redundancy is a good practice too: if a metric is mission-critical, have a backup method. For example, if RFID is primary for counting booth visits, consider having a manual tally or secondary sensor just in case, so you’re not empty-handed if one system glitches. When sponsors see that you’ve executed the measurement plan professionally, it further reinforces trust.
Presenting Results and Keeping Sponsors Engaged
Once the data is compiled and the post-event report is ready, it’s best to present it in a collaborative way. Rather than just emailing a PDF, try to schedule a debrief call or meeting with the sponsor. Walk them through the results, highlighting both successes and any areas that fell short. If something didn’t hit the mark, show that you’re already thinking of improvements (“We noticed only 25% of attendees engaged with your booth; next year, we recommend a more central location and a bigger draw, like a game or celebrity host, to drive that up”, applying learnings and insights for future growth). By doing this, you turn the ROI report into a springboard for future planning. Also, explicitly ask for the sponsor’s feedback: Did the metrics provided cover what they needed? Are there additional insights they’d like next time? This not only helps refine your measurement plan, it makes the sponsor feel heard and involved. If the partnership was successful, this meeting is also the perfect time to discuss renewal – you have the hard numbers to back up the ask. Many a savvy organizer will end the meeting with a proposal for next year: “Given these great results, how would you feel about expanding your sponsorship to our other festival or signing on again now?” Data in hand, that pitch is far more convincing. And if results were outstanding, don’t be shy about encouraging the sponsor to share the success story – perhaps a joint press release or a case study. When sponsors publicly talk about the ROI they got (e.g., “Brand X saw 50,000 engagements at Event Y, resulting in a 20% sales uptick in that region”), it’s marketing gold for your event – and further proof to other potential sponsors. In summary, presenting ROI is not a one-way dump of stats; it’s a dialogue that solidifies the sponsor relationship and paves the way to future collaborations.
Building Long-Term Sponsor Partnerships with Data
Using Data to Earn Trust and Renewals
Consistently providing clear ROI data transforms the sponsor-organizer relationship from a simple transaction into a trusted partnership. Sponsors come to see your event as a reliable vehicle for their marketing goals because you’ve shown concretely what they get out of it. This trust makes sponsors more likely to commit to multi-year deals. In fact, a best practice for multi-year sponsorships is demonstrating year-over-year improvements: if you can show that each year you fine-tune and deliver even better results, it’s a strong incentive for a sponsor to secure multi-year festival sponsorships. For example, maybe last year 30% of attendees interacted with the sponsor, and you applied learnings to reach 50% this year – that trend gives the sponsor confidence that their investment will keep growing. Always treat the current event’s sponsorship as if it’s a pilot for a bigger partnership. Document everything, share successes enthusiastically, and also note what can be improved next time (showing you are proactive about increasing ROI further). Many sponsors have internal annual budgets – and if you make their decision-makers look good by delivering impressive numbers, they will pencil your event into next year’s plan early, aware of their need to report on revenue. Also, when a sponsor trusts your data, they might share more of their data – like actual sales figures or customer insights – which can help both sides evaluate true ROI in depth. It’s not unusual for a strong partnership to evolve into co-development of activations, where sponsor and organizer brainstorm together on innovative tech experiences precisely because they have a foundation of data proving what works. In short, data builds trust, and trust builds long-term business.
Storytelling with ROI Data
Data alone, however, isn’t enough – it’s how you use it to tell the story of a sponsor’s impact that matters. Year after year, craft a narrative that aligns with the sponsor’s broader brand story. For example, if a sponsor’s mission is sustainability and they supported your festival’s eco-friendly initiatives, don’t just count impressions – highlight how “10,000 attendees engaged with your sustainability quiz, and 85% said they learned something new about recycling”. That shows the sponsor achieved a thought leadership or educational goal, which is part of ROI (sometimes called Return on Objective (ROO)) or Return on Objectives that sponsors value. Many sponsors will have qualitative objectives alongside quantitative ones. Incorporate those into the narrative: brand affinity, community goodwill, etc. For instance, “Through your sponsorship of the community stage, 12 local bands got to perform. Attendee feedback mentioned your brand positively in fostering local talent – an intangible ROI in goodwill that strengthens your brand image.” By framing the data in a human context (what it meant for attendees, how it ties to the sponsor’s values), you make the ROI report much more compelling. It also shows you understand the sponsor’s definition of success beyond just numbers. Over time, include comparative benchmarks in your storytelling: e.g., “This year’s engagement was 15% higher than last year’s, and double the industry average for similar events.” If you have access to any industry reports or benchmarks (some sponsorship agencies publish average trade show lead counts, etc.), use them to give context. Sponsors may not know what “good” looks like for certain metrics until you tell them “this was good, and here’s why.” By continuously refining the story – with data as the plot points – you help sponsors internally champion the partnership. Many corporate sponsors have to present an ROI summary to their execs; when you’ve already given them a great story with backed-up data, you’re indirectly marketing your event inside their company. That can lead to bigger budgets allocated your way in the future, or at least an easier renewal process.
Joint Innovation and Evolving Value
When sponsors see that you’re committed to delivering value, they often become more open to innovation and co-creation. The data might reveal opportunities that you can pitch as new ideas. For example, your analytics show the sponsor’s session was packed and had high app engagement – maybe next year you propose a larger sponsored track or a keynote slot. Or you noticed many attendees scanning the sponsor’s QR code for a discount – perhaps the sponsor could expand that concept into a full loyalty program tie-in at the event. Use ROI insights to suggest new sponsor activations or tech tools that could elevate results further. This positions you not just as an event organizer, but almost like a marketing consultant for the sponsor. It’s a value-add they won’t get if they go to a competitor event that doesn’t take this approach. Additionally, keep an eye on emerging tech that could benefit sponsors and measure new types of ROI. The landscape in 2026 includes things like AI-driven personalization (maybe an AI in the app suggests sponsor content to the attendees most likely to be interested, increasing conversion) or even blockchain-based engagement rewards (imagine distributing NFT collectibles for interacting with sponsors, which can be tracked and traded). If you experiment with these, do so in a way that’s manageable and be ready to show how they contribute to ROI. Not every sponsor will want to be an experiment, but many will appreciate that you are always looking to innovate the value proposition. One example: a venue noticed through data that fans loved playing AR games during downtime; they pitched a big sponsor on creating a permanent AR feature in the venue app, sponsored year-round. The sponsor signed a multi-year deal to essentially own that feature, because the initial data proved fans would engage. This only happened because the organizer was proactive in turning data into a creative opportunity. Thus, proving ROI should be seen as an ongoing cycle – measure, report, refine, ideate, and grow together with your sponsors.
Frequently Asked Questions
What metrics do event sponsors expect in 2026?
Sponsors in 2026 demand hard data and measurable ROI metrics rather than vague exposure claims. They expect granular proof of value similar to digital advertising, requiring organizers to report on impressions, engagement time, lead capture, and revenue influence to justify the roughly 12% of marketing budgets allocated to sponsorship.
How does RFID technology measure sponsor ROI at events?
RFID and NFC technologies track physical engagement by logging attendee movements via smart wristbands or badges. These systems record zone entries and dwell times at sponsor booths, providing precise data on unique visitors and engagement duration. Organizers use this data to prove foot traffic and interaction quality to sponsors.
Can mobile event apps track sponsorship value?
Mobile event apps serve as powerful ROI engines by tracking digital metrics like banner impressions, click-through rates, and video views. Advanced apps leverage location services for geo-targeted notifications and measure conversion from digital interest to physical booth visits, offering a unified view of attendee engagement across digital and physical channels.
Why is gamification effective for sponsor activations?
Gamification drives active attendee behavior by incentivizing interactions with multiple sponsor touchpoints through challenges like scavenger hunts. It increases foot traffic and dwell time while seamlessly capturing data via scans or app interactions. This strategy converts fun experiences into measurable outcomes like lead generation and completion rates for sponsor reports.
How can real-time data improve event sponsorship results?
Real-time dashboards allow organizers to monitor sponsor zone traffic and engagement levels during the event. If metrics are low, organizers can immediately intervene by sending push notifications, making announcements, or redirecting crowds to specific areas. This proactive management ensures sponsors achieve their exposure targets before the event concludes.
What is the difference between impressions and engagement in event reporting?
Impressions represent the broad count of potential views a sponsor’s branding receives, similar to advertising reach. Engagement metrics track active participation, such as booth visits, app clicks, or contest entries. Sponsors increasingly prioritize engagement and dwell time as they indicate genuine interest and higher quality interactions compared to passive exposure.
What is the best way to track sponsor ROI through ticket sales?
The most effective method is issuing unique affiliate tracking links or custom promo codes to each sponsor. When partners promote your festival or conference to their audience, you can track exactly how many registrations or ticket purchases originated from their specific channels, providing a clear, direct revenue metric.
How do we prove ROI to sponsors with platforms providing detailed analytics on booth visits and banner ad clicks?
To effectively prove return on investment, organizers must utilize an integrated event technology stack. The ideal platform provides detailed analytics on both physical and digital touchpoints—such as RFID data for booth visits and event app metrics for banner ad clicks. Combining these data streams allows you to present a comprehensive report showing exactly how attendees interacted with the brand.
How do organizers approach measuring ROI on esports event sponsorship deals?
Measuring ROI on esports event sponsorship deals requires a hybrid approach that combines physical on-site metrics with digital broadcast data. Organizers track in-person engagement using RFID and event apps, while simultaneously analyzing streaming metrics like concurrent viewership, chat interactions, and on-screen logo exposure to provide a complete picture of brand reach.
How do the best sports sponsorship ROI tracking tools compare in accuracy?
When comparing the accuracy of sports sponsorship ROI tracking tools, RFID and NFC systems lead with near 100% precision for direct interactions, as they require intentional taps. Wi-Fi and Bluetooth beacons offer around 80-90% accuracy for passive foot traffic and dwell time, depending on venue interference. Computer vision cameras provide excellent broad-scale exposure metrics but are best layered with deterministic tools like RFID for verifiable lead capture.
What are the best Fan Activation Systems (FAS) and tools for maximizing sponsorship revenue?
The most effective Fan Activation Systems (FAS) integrate directly with your event’s ticketing and access control infrastructure. These tools maximize sponsorship revenue by offering interactive modules—such as digital passports, gamified reward tiers, and instant-win mechanics—that incentivize attendees to engage with brand partners, thereby generating measurable leads and verifiable ROI.
How can organizers track golf course marketing ROI for brand partners?
To accurately track golf course marketing ROI, organizers should deploy geo-fenced event apps and Bluetooth beacons across the venue. By mapping specific sponsored holes, hospitality tents, and VIP greens, promoters can capture precise dwell times and foot traffic data, proving exactly how many attendees interacted with a sponsor’s activation across the expansive outdoor footprint.
What are the most important sponsorship KPIs to track at events?
The most critical sponsorship KPIs (Key Performance Indicators) depend on the brand’s specific goals but generally fall into three categories: visibility, engagement, and conversion. Top visibility KPIs include total brand impressions and foot traffic. Engagement KPIs measure interaction quality, such as average dwell time, booth visits, and event app click-through rates. Conversion KPIs track direct business outcomes, including qualified leads captured, on-site sales, and promo code redemptions.
How does Splash event management software help track sponsor ROI?
Splash event management software assists organizers in tracking sponsor ROI by consolidating guest data from the initial RSVP through to on-site check-in. Its built-in analytics and customizable reporting dashboards allow promoters to easily demonstrate attendee engagement levels and conversion metrics to their brand partners.
What are the best event networking platforms for sponsors and exhibitors to maximize ROI in 2025 and 2026?
The top networking solutions for B2B events prioritize AI-driven matchmaking, automated lead scoring, and seamless CRM integrations. Platforms that facilitate pre-scheduled one-on-one meetings and track digital handshakes provide the most concrete return on investment. By 2025 and 2026, organizers should look for tools that offer robust API ecosystems to connect these digital interactions directly with physical booth traffic data.
How do you establish a baseline for an event sponsorship KPI?
Establishing a baseline for an event sponsorship KPI requires analyzing historical data from previous events or industry benchmarks. By reviewing past performance metrics—such as average booth dwell times, standard app click-through rates, or typical lead conversion percentages—organizers can set realistic targets. This historical context allows promoters to accurately measure whether a new brand activation underperformed or exceeded standard expectations.