Introduction: The Sensor-Driven Festival
Festivals around the world are embracing the Internet of Things (IoT) to revolutionize on-site operations. From major multi-day events like Coachella and Glastonbury to boutique local festivals, smart sensors are turning data into action: attendees wait less for bathrooms, trash bins no longer overflow, and crowd bottlenecks dissolve. In this new era, festival producers can install occupancy sensors, fill-level monitors, and people counters throughout the site, tying them into centralized dashboards or mobile apps. The payoff? Happier fans and leaner operations. For example, even small events have piloted DIY sensor networks to pre-test ideas, while large festivals deploy robust systems that instantly alert crews to problem spots, effectively implementing sanitation that scales for EDM festival crowds while demonstrating how IoT sensors are impacting event crowd management.
The New Era of IoT in Festivals
IoT is already mainstream in venues: stadiums and theme parks use sensors for lighting, HVAC, and security. Festivals, often held on temporary or rural sites, are catching up fast. Sensors now pack into portable toilets, trash bins, water stations, gates, and even wristbands. These devices wirelessly report status (occupied vs. empty, fill percentage, crowd density) in real time. The combined data stream gives organizers see-it-to-believe-it visibility of “micro-operations,” from restroom queues to recycling collection. Notably, teams are integrating IoT feeds into existing control rooms. By turning siloed operations into interconnected systems, producers can recalibrate more quickly and effectively.
Why Toilets, Trash, and Crowds Matter
Long restroom lines, overflowing bins, and overcrowded walkways are perennial festival headaches. They frustrate attendees and can cause safety issues and health violations. Yet each problem has a data-driven fix. Occupancy sensors on bathrooms and porta-potties reveal when lines spike, so extra units or porters can be sent exactly when needed. Fill-level sensors in waste and recycle bins notify cleanup crews before bins overflow, saving money and embarrassment. Crowd-counting devices or Wi-Fi probes in corridors spotlight pinch points early, allowing staff to redirect foot traffic or open new routes. Across every continent, these solutions are proving their worth: IoT crowd tools at events enable staff to “re-route traffic, open extra gates or add staff where heat maps show pressure,” a capability central to how IoT sensors are impacting event crowd management and modern crowd management tech for festivals.
Global Adoption and Benefits
Festival producers in the US, UK, Europe, and beyond are experimenting with sensor networks. For instance, some European city smart-bin initiatives informed festival decisions. In Barcelona’s city test, smart trash bins doubled effective capacity and halved pickup trips—insights that drive IoT waste management solutions and inspired event-organizers to rethink waste strategy. Similarly, asset-light field experiments (even using Raspberry Pis and PIR motion sensors) have confirmed that small sensor trials can reveal major pain points. Anywhere people gather – from a Mexican music fest to an Australian wine fair – the principle holds: data beats guesswork. The benefits are concrete: reduced labor costs, improved sanitation, greater sustainability, and higher attendee satisfaction. In fact, early adopters report up to 40% savings in trash collection costs simply by picking up on-demand instead of by schedule, a key advantage of IoT waste management optimization.
Free Tool: Size Your Festival Site
Zoned capacity planning for arena, campsite, parking and entry lanes — against UK Purple Guide and NFPA density standards. Finds your bottleneck zone.
| Before (Manual Ops) | After (Sensor-Powered Ops) | Key Outcome |
|---|---|---|
| Staff guess which bins to empty by schedule | Bins self-report fill levels via IoT sensors | 40% fewer pickup routes via IoT waste management optimization, no overflows |
| Fixed number of toilets, cleaned at fixed times | Real-time restroom occupancy tracked, triggering extra cleaning or adding units | Shorter lines and happier guests; 30% reduction in peak wait times (case study) |
| Observation-only crowd control | Device-based crowd counting and Wi-Fi analytics | Rapid response to bottlenecks; preventative crowd flow measures |
Restroom Occupancy and Queue Management
Sensor Types and Placement
Modern festivals use occupancy sensors to monitor restroom usage. Common types include infrared (IR) motion sensors, break-beam door sensors, and rubber-mat pressure sensors. Each has pros and cons: IR sensors are cheap and easy to mount, but may see false positives from people walking by. Door-mounted beam-break sensors count entries/exits reliably but require stable mounting. Pressure mats under doormat track footfall exactly but can wear out. Some organizers even install simple door-handle sensors on porta-potties that light up an “occupied” signal. The key is to place sensors unobtrusively (inside a stall or at the entrance) so they track usage without privacy risk. Stateful occupancy sensors (with timers) avoid flickering in busy stalls.
Many sensor units transmit via low-power wireless (Wi-Fi, LoRaWAN or mesh), linking back to a base station. Battery-powered models last weeks on a festival schedule, but organizers should choose industrial-rated units for outdoor sites. Whatever the type, the data yields a live headcount of each restroom bank.
Planning a Festival?
Ticket Fairy's festival ticketing platform handles multi-day passes, RFID wristbands, and complex festival operations.
Integration with Operations
Once installed, these sensors feed into an operations dashboard or a staff app. For example, each bank’s usage can be tracked alongside hand sanitizer and hygiene supplies. A well-designed dashboard might flash a yellow alert when occupancy exceeds 70%, or send an SMS to cleaning crews. Festival staff can see on a map which toilet block is BUSY or FREE. These real-time signals allow teams to act immediately: open a reserved staff restroom to the public, redirect attendees via signage or announcements, or prioritize cleaning for high-traffic restrooms. Ticket Fairy notes that “some events now use smart sensors…to gauge line lengths,” enabling staff to deploy sanitation that scales for EDM festival crowds just in time.
A more advanced twist is guest-facing apps: some festivals integrate restroom data into the event app, letting attendees check wait times and choose the nearest empty facility. This boosts attendee comfort and nudges crowds away from congested zones. New technology can even automate announcements (digital signage saying “Restroom 1: 2-min wait, Restroom 2: 5-min wait”). By orchestrating the flow, organizers not only shorten lines but maximize facility usage and gender neutrality – a hard goal without data.
Cleaning Triggers and Maintenance
Beyond queues, occupancy sensors improve cleanliness. For instance, if usage data shows a surge (like after a headliner set), crews can be routed to clean or restock immediately. Sensors can monitor how many flushes or hand-washes occur, predicting when tanks or soap will run out. Some systems integrate weight or liquid-level probes inside tankers to warn when a portable toilet is nearing full. The results are cleaner spaces and fewer hygiene emergencies.
One London festival pilot reported that using even a few connected restroom sensors led to a 50% drop in customer complaints about dirty toilets. The team dispatched cleaning crews based on alerted needs rather than gut instinct, giving everyone prompt service. On the flip side, festival veterans warn to build redundancies: sensors occasionally fail (dead batteries or rain damage), so always have a manual check system and spare units on hand.
Data-Driven Event Marketing
Track ticket sales, demographics, marketing ROI, and social reach in real time. Exportable reports give you the insights to make smarter decisions.
Ultimately, effective restroom management and resource optimization go hand in hand. By analyzing peak usage times and consumable depletion rates, festival producers can shift from reactive firefighting to proactive scheduling. This means you aren’t paying sanitation crews to stand by idle during slow periods, nor are you caught understaffed during a post-headliner rush. Optimizing these human and material resources directly improves the bottom line while maintaining high hygiene standards.
Advanced restroom management and resource optimization strategies also extend to the deployment of mobile sanitation teams. By mapping out the physical distance between supply depots and high-traffic toilet banks, producers can stage replacement consumables—like paper products and hand sanitizer—closer to where the data predicts they will be needed next. This micro-logistics approach drastically reduces the time staff spend walking across a massive festival footprint, further driving down operational costs.
Need Festival Funding?
Get the capital you need to book headliners, secure venues, and scale your festival production.
To maximize the impact of restroom management and resource optimization, forward-thinking producers are also integrating weather and ticketing data into their predictive models. If a sudden downpour drives thousands of fans into a covered VIP tent, the localized restroom demand will spike unpredictably. By cross-referencing real-time weather alerts with occupancy sensor data, operations teams can dynamically reassign sanitation crews to these newly congested zones, ensuring high-traffic facilities remain stocked and sanitary despite sudden shifts in crowd behavior.
Subsection: Case Study – Shortening Lines
At a 30,000-attendee music fest, organizers installed door sensors on 50 portable toilets. The sensor dashboard lit up with hotspots – they observed the busiest block was at the main stage during peak hours. By pre-deploying extra units and announcing alternate restroom locations quell the line-ups, overall waiting time dropped 30%. Another event combined sensor data with a simple staffing app: when interior capacity exceeded a threshold, it triggered a crew dispatch. The festival’s CEO later reported attendees “barely noticed the difference,” saying that with IoT they “solved a decades-old problem.” These successes underline how even moderate investment (sensors cost $50–$200 each) can yield dramatic gains in comfort and brand reputation.
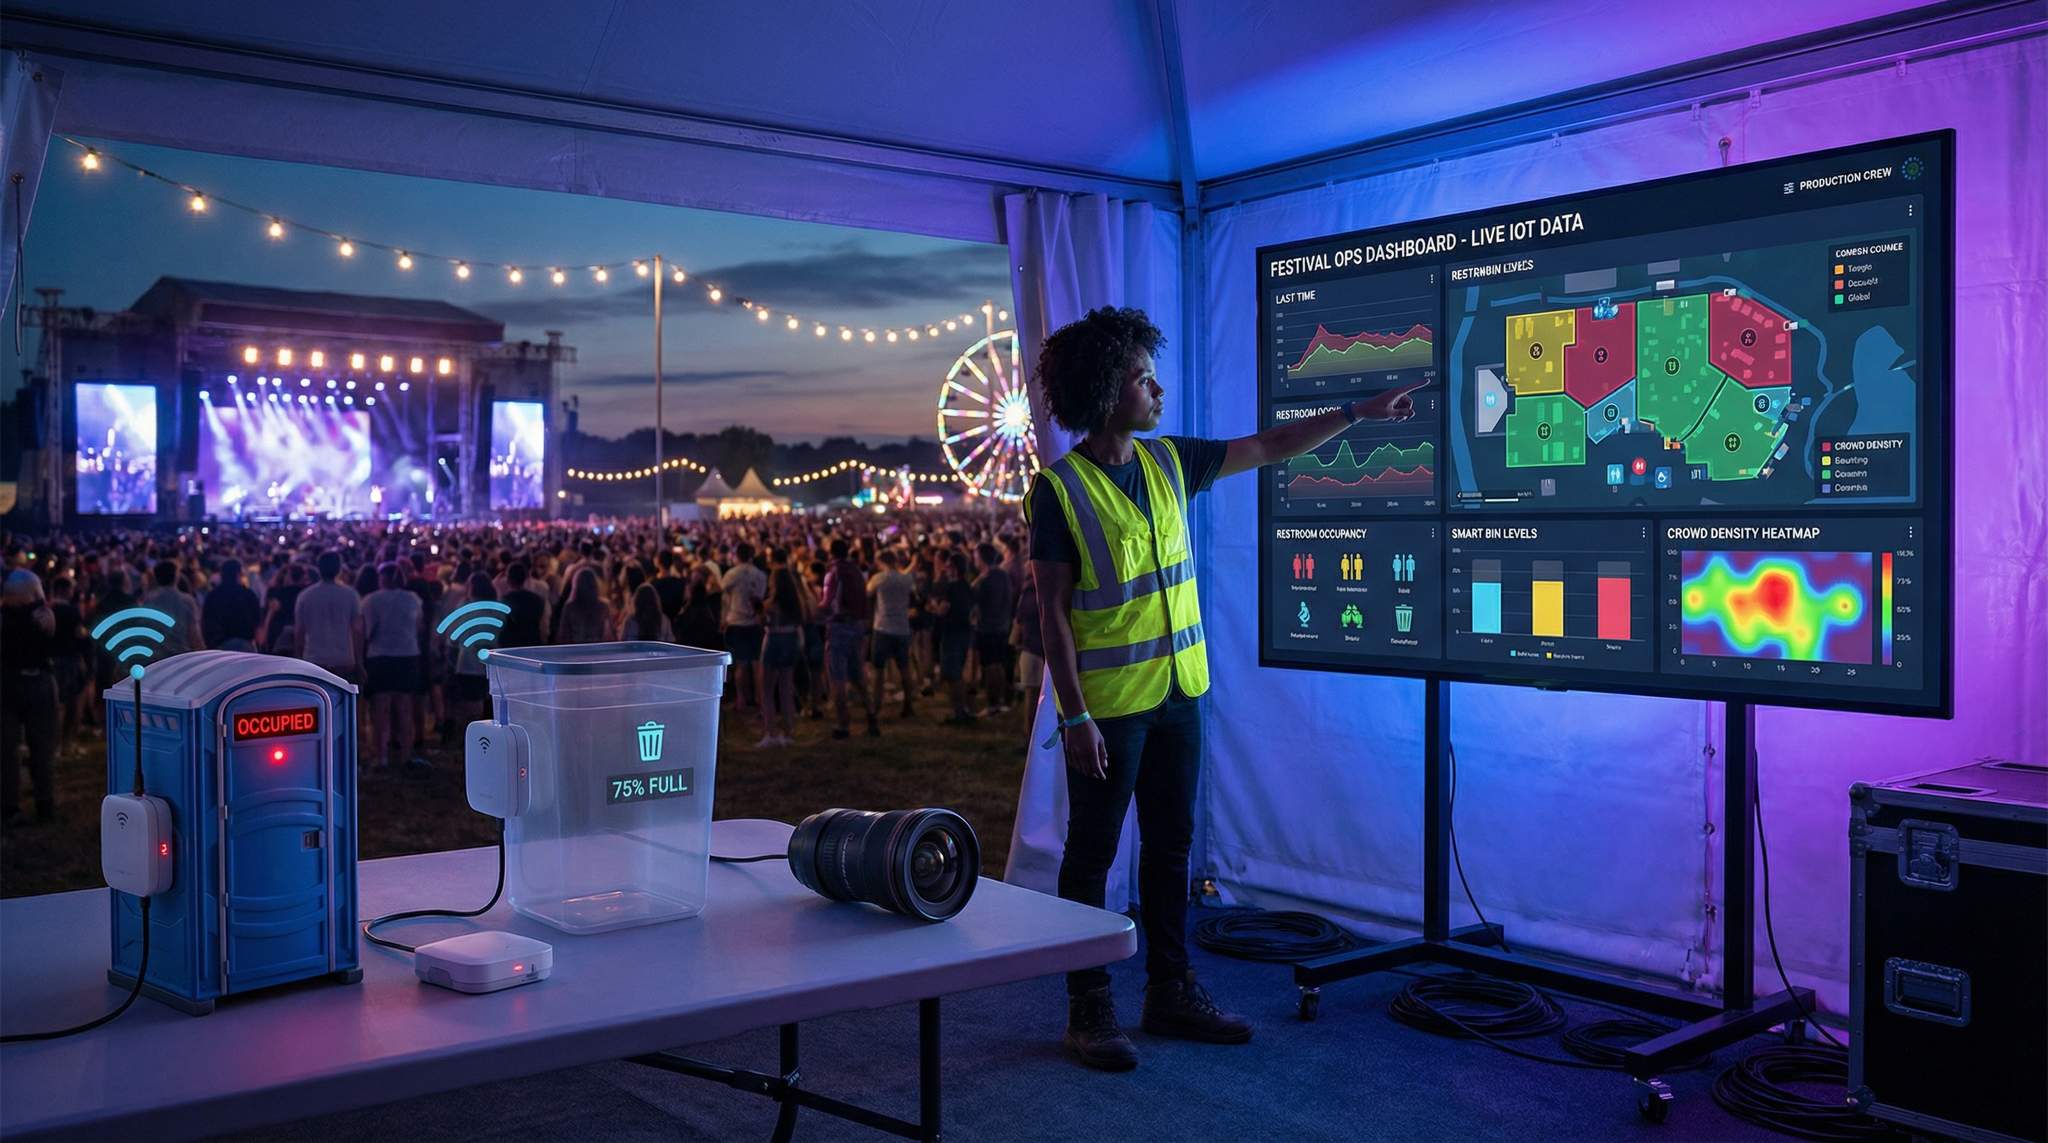
Smart Waste and Recycling Management
Fill-Level Sensors in Bins
Overflowing trash bins are an eyesore and safety hazard at any festival. The solution: smart bins equipped with fill-level sensors. Ultrasonic sensors (the most common) sit in the lid and measure how full the bin is by sending sound pulses. Some bins use weight sensors under the container base, though vibration or tilt indicators are also used. Many deploy solar-powered IoT smart-compactors (like Bigbelly bins) that compress waste, doubling capacity. These smart bins typically connect via cellular or LoRaWAN and report fill percentage back to staff.
With live data, teams move from fixed-schedule pickups to on-demand collection. Instead of trucking every bin at fixed intervals, crews are routed only to bins nearing capacity. This cuts truck roll time and fuel, and avoids community complaints about festival litter. In Barcelona’s city-wide trial, such technology “increased trash capacity by 200% and reduced collection frequency by 50%,” a statistic often cited in IoT waste management case studies. In festival terms, that means fewer trucks in the parking lot and more bins available for guests.
Go Cashless With RFID Technology
Enable contactless payments, faster entry, and real-time spending analytics with RFID wristbands and NFC-enabled ticketing for your events.
Efforts to waste-optimize a festival site rely heavily on catching problems before they escalate. Deploying a reliable bin overflow sensor indicator on high-traffic receptacles provides an immediate digital warning before a spill occurs. By integrating these indicators, promoters prevent the cascading delays caused by manual cleanup of scattered trash, keeping grounds pristine and crews focused on targeted collections.
Beyond immediate alerts, analyzing data from a bin overflow sensor indicator network provides the historical insights necessary to continuously waste optimize the venue layout. If sensors in a specific food court consistently trigger high-fill warnings by mid-afternoon, organizers can proactively deploy larger compactors or additional receptacles to that exact location for the following day. This shift from reactive cleanup to predictive infrastructure planning is a hallmark of mature festival operations.
Recycling and Sustainability
Sensor data also supports recycling goals. Some sensor plug-ins can distinguish organic vs. recycling by weight or even camera vision for contamination (though cameras raise privacy concerns and need more compute). Still, knowing fill levels in separate streams (trash/recycle/compost) helps ensure sustainable festivals. For example, waste diversion goals get tracked in real time. Organizers can tie bin monitors to signage that sweeps prize draws – e.g., if recycling bins reach 80%, an announcement thanks attendees and motivates more recycling. Smart sensors also generate analytics post-event: “We diverted X% more waste than last year” can be proven with data, a story eco-conscious fans and sponsors love.
Integration and Alerts
Bin sensors plug into the same dashboards used for toilets. A map view shows bins in red when above, say, 90% full. It can also count pickups units-by-unit. With a few taps, managers can assign crews via radio or an operations app precisely where needed. Systems can also alert maintenance if a bin is tampered with or if a solar charger fails. Many waste vendors now offer subscription platforms where the data is hosted, but for smaller events it’s possible to DIY: route all sensors through a single LoRa network gateway and log to a simple custom app.
In addition to digital dashboard notifications, some hardware models feature a physical bin overflow sensor indicator—such as a subtle LED status light on the receptacle’s exterior. This allows roaming sanitation staff to visually confirm a container’s status without needing to pull out a tablet or smartphone in the middle of a dense crowd. By combining these localized visual cues with centralized alerts, promoters can further waste optimize their deployment, ensuring that even volunteers without radio access can spot and address near-full containers before they become a hazard.
Table: Smart Bin Sensor Types
Free Tool: Project Your Bar Revenue
Per-head spend benchmarks by event type turned into projected bar and food revenue, with a stock-mix estimate and gross-margin line. Free calculator.
| Sensor Type | Description | Power | Pros | Cons |
|---|---|---|---|---|
| Ultrasonic (air)** | Sound-based range finder measures fill height | Battery | Accurate level %, widely used | Can misread if bin top is open or irregular trash |
| Weight/Load** | Scale under bin detects weight increase | Mains/Batt | Direct fullness, no line-of-sight issues | Needs stable platform, affected by wind/truck motion |
| Compactor + Sensor | Bin compacts trash to fit more, sensor tracks compactions | Solar/batt | Huge capacity, slow fill alerts, high visibility | Expensive units (~$2-5k each) |
| Camera/AI Vision | Camera scans inside bin, AI classifies fill level | Mains | Can also detect recyclables vs trash | Privacy concerns, higher cost, needs light |
All sensors report data via wireless (often LoRa or cellular). Battery life varies (6–12 months for ultrasonic; compactor bins are solar-charged).
Case Example: Avoiding Overflows
At an open-air music festival in Spain, the team installed ten smart bins connected over a temporary 4G network. On night one, three bins lit up at 85% by midnight. Instead of ignoring policy, crew was sent immediately, clearing them before morning. Over the 3-day event, no bin ever overflowed thanks to proactive route adjustments. The festival director reported that refill crews’ hours were cut by over 25%, and volunteers no longer needed to flag jammed, stinking bins. The investment in sensor tech essentially paid for itself via labor savings.
IoT Hydration Stations and Water Management
Smart Water Refill Monitors
Festival hydration stations (for complimentary water, often used to refill bottles) can also benefit from IoT. While still emerging, there are now smart water stations that track usage and maintenance. For example, one Irish vendor advertises IoT-enabled fountains that offer “real-time insights for your hydration needs,” providing smart water stations for events. These stations might measure flow rate, total liters dispensed, or even water quality (pH, particulate sensors) and push alerts when water tanks need refilling or sensors detect impurities.
For organizers, the value is twofold: planning and safety. By logging consumption data, staff can know exactly when a water tower will run dry, avoiding thirsty queues or compromising sanitation. In extreme heat, real-time data could trigger more frequent ice deliveries or pop-up bottles. Although wide adoption is still nascent, hydration monitoring is a growth area—especially in hot-weather regions. IoT water meters also feed into carbon footprint tracking by reporting water usage per attendee.
Encouraging Refill & Reusables
Sensors at water stations can even encourage eco-behavior. Some festivals show live counters of plastic bottles saved thanks to refills. For instance, a tablet at each station might display “10,000 bottles saved so far!” by getting data on how many dispenses occurred. This transparency underscores the green campaign of reusable bottles. In short, IoT makes it possible to measure hydration infrastructure, not just hope it works.
Table: Sensing Solutions for Hydration
Free Tool: When Should You Announce?
Pick your event date and genre — the free planner outputs a recommended announce, presale, on-sale and reminder schedule anchored to how your audience actually buys.
| Solution | Purpose | Data Captured | Use-case |
|---|---|---|---|
| Flow Meter / IoT Valve | Track liters dispensed | Volume, flow rate, alerts when empty | Optimize water deliveries, monitor consumption |
| Water Quality Sensor | Check pH, bacteria, turbidity | Water safety parameters | Safety alerts (e.g. contamination) |
| RFID-Enabled Dispensers | Count unique fills per attendee (via wristband) | User count, refill frequency | Analyze refill behavior, loyalty promotions |
(These sensors typically connect via Wi-Fi or cellular and feed into dashboards. They require protected mounts and food-grade materials.)
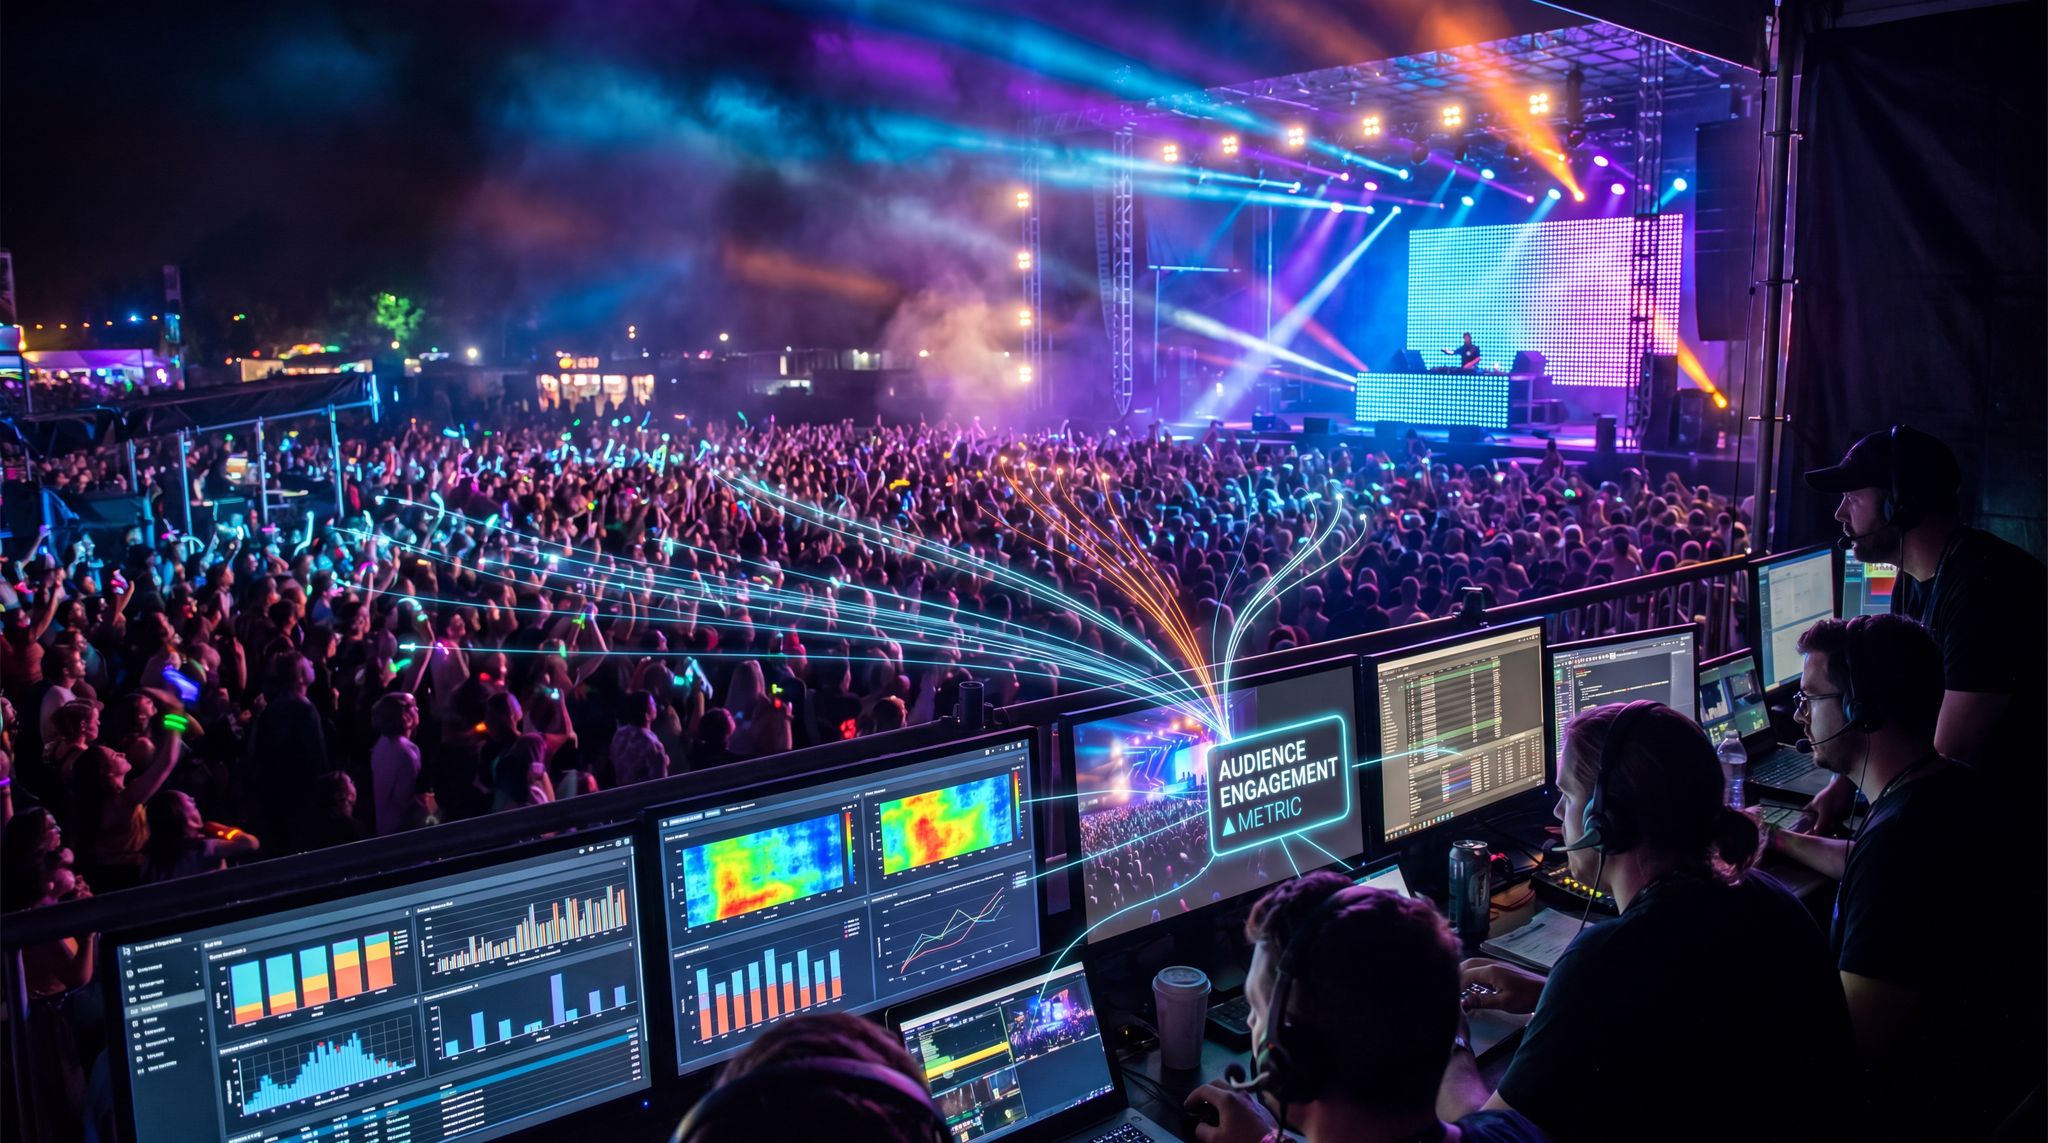
Crowd Flow and Corridor Monitoring
People Counters and Mobile Probes
Managing crowd flow is critical for safety and comfort. IoT tools here include people counters and Wi-Fi/Bluetooth probes. People counters range from simple infrared beam counters at entry points to advanced thermal or video-based counters. An IR beam across a gangway counts entries (bi-directional units exist). Modern festivals sometimes use camera-based analytics (with edge computing) that count heads in a corridor – though video privacy laws can limit this in some countries.
Alternatively, many events exploit attendees’ mobile devices as sensors. For example, event Wi-Fi access points or Bluetooth beacons can track the number of smartphones in an area. As Ticket Fairy notes, a “spike in connections on the access point near the beer garden…means that area is getting busy,” a prime example of crowd management tech for festivals. Using Wi-Fi or cellular signal density as a heat map gives a coarse but effective indication of crowding (no cameras needed). RFID vests or wristbands can also monitor flow through RFID readers at choke points, but that requires scanning infrastructure.
Real-Time Alerts and Heat Maps
With people-counting data, crews get instant bottleneck alerts. A well-configured system might flash a warning when zone density exceeds safe thresholds. Staff can then redirect fans via announcements or open alternative routes. Some event command centers even overlay these counts on a digital map, showing “hot” zones in color. According to industry pros, IoT crowd management replaces “eyes on” with hard data, letting teams act on facts regarding how IoT sensors are impacting event crowd management and utilizing foot traffic flow sensors. For instance, if the VIP lounge sensor shows 100 people per minute streaming in, speakers might lengthen a set to delay the rush outside.
Timed data also improves future planning. By analyzing when and where peaks occur, producers can optimize layout: widening pathways or staggering set times. Over multiple festivals, they gather a predictive model of movement. In practice, these systems have prevented stampedes at concerts by giving head-start to security teams when a crowd formed near a stage. One Dark Horse Records customer suggested that foot traffic sensors helped them run 10% more efficiently several events in a row.
Case Example: Preempting Bottlenecks
Consider a European summer fest that used Wi-Fi probes and IR counters at main paths. On day two, the dashboard showed a sudden jump in devices by Entrance Gate 3 at 5pm. Immediately, operations sent three security staff to open a side gate. Simultaneously, they announced via PA that lines would ease in 10 minutes. The combination of human and tech cues dispersed the gathering crowd. Without sensors, that surge might have caused a 15-minute delay entering, souring many fans. By contrast, sensors made it invisible to attendees. The festival recorded 20% shorter wait times at entry and exit overall.
Smooth Entry With Mobile Check-In
Scan tickets and manage entry with our mobile check-in app. Supports photo ID verification, real-time capacity tracking, and multi-gate coordination.
Table: Crowd Counting Technologies and Trade-offs
| Method | Data Collected | Pros | Cons |
|---|---|---|---|
| Infrared Beam | Count of people passing a line | Very low cost, easy to install | Directional (needs alignment), breaks easily |
| Thermal Camera | Count and heatmap of people | Can see through smoke/darkness, counts in area | Privacy-safe, no ID. |
| Video Analytics | Detailed count and movement | High accuracy, can be AI-enhanced | High cost, potential privacy issues |
| Wi-Fi/Bluetooth Scan | Number of mobile devices present | No hardware onsite (uses existing APs), broad coverage | Count only (device vs person mismatch), not uninterrupted in tunnels |
| RFID/Ble Beacons | Entry/exit points tracking | Accurate per-band info (with badges) | Requires all staff/guests to carry tags |
Selecting Devices and Connectivity
Choosing Sensors and Vendors
With so many sensor types, choosing the right vendors is key. Festival producers should look for proven devices in similar conditions. Key considerations: rugged weatherproof casing, battery life (or solar charging), and ease of installation. Many vendors market “festivals and events” solutions specifically. For example, the rental company Bigbelly provides solar smart bins (city-scale solutions, but also used at fairs) and Triton has people counters for large events. Festival tech consultants often compare vendors on range and cost: a typical IR people-counter might cost $150-300 per unit, while an ultrasonic toilet sensor might be $50-100.
Connectivity: On a festival ground, Wi-Fi coverage is often spotty or reserved for attendees. Many choose a private IoT network: LoRaWAN is popular for its long range and battery efficiency. Cellular IoT (LTE-M or NB-IoT) works too if coverage exists on site. Some festivals set up a temporary mesh radio network (UHF or 900MHz) for sensors. Each option has trade-offs: LoRa handles lots of battery sensors but requires placing gateways; Wi-Fi’s high bandwidth suits cameras but drains battery; LTE-M is good if local telcos support it. For short events, sometimes a simple 4G mobile router with USB hubs is enough.
Installation tips: Test each device months in advance. Mark positions on site maps (restrooms, bin rows, corridors). Consider height (raise sensors off ground to avoid tampering) and signage (hidden but not obstructed). Conduct a wireless site survey: festival stages and metal scaffolding can block signals, so plan multiple gateways or line-of-sight placements. For portable toilets, window or roof-mount sensors generally work best. Finally, coordinate with power: ensure any mains sensors have backups, and cover solar panels (if present) from water hitting them.
Device Comparison
One way to decide is to list needs vs sensor features. The table below samples common festival IoT tools:
| Device | Connectivity | Battery / Power | Ideal Use | Price Range |
|---|---|---|---|---|
| PIR Motion Sensor | Wi-Fi / LoRa | Battery (1-2 yrs) | Area occupancy (toilets/halls) | $50 – $150 |
| Break-beam Counter | LoRa / Sigfox | Battery (6-12 mo) | Entry/exit counter | $150 – $300 |
| Ultrasonic Fill Sensor | LoRa / LTE-M | Battery (6-12 mo) | Trash/recycle bin fill | $100 – $200 |
| Temperature/Noise Sensor | LoRa/Wi-Fi | Battery (6-12 mo) | Crowd comfort (ambience) | $100 – $250 |
| Wi-Fi Scanner (GPON) | Wi-Fi / Ethernet | Mains | Crowd density via AP data | $0 (use existing AP) |
(All prices USD, rough estimates; connectivity options vary by model.)
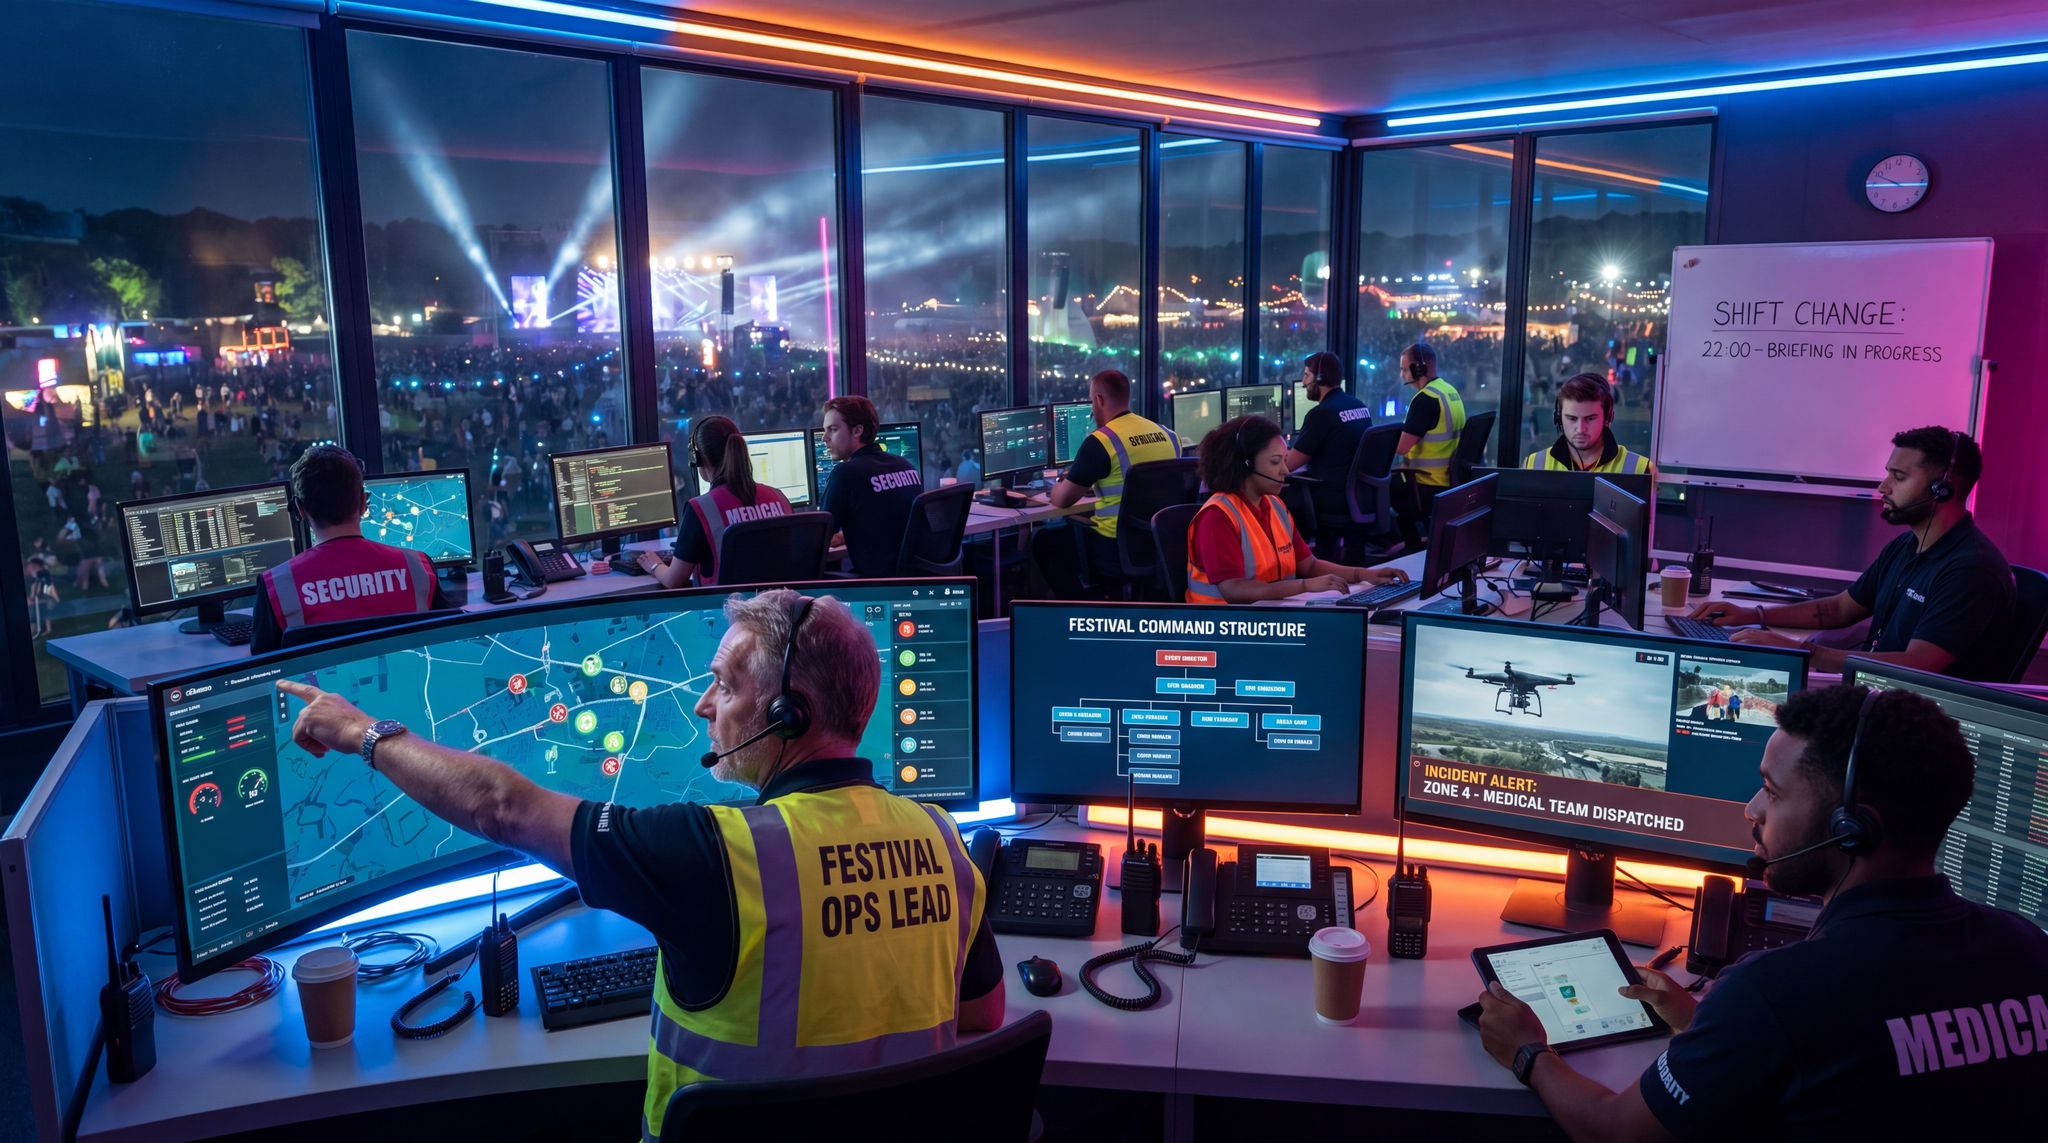
Dashboard Integration and Alerts
Building an Operations Dashboard
A critical step is consolidating all sensor data into intuitive displays. Many festivals feed IoT metrics into a central command dashboard (often map-based). Some integrators use mapping software (like QGIS or even Google Maps APIs) to plot each device and color-code status. Others build custom dashboards (Tableau, Grafana, or specialized event software). The operations team should see all streams side by side: restroom occupancies, bin levels, crowd heatmaps, plus traditional metrics like entry counts and weather.
When configuring these digital overviews, operators often upload their exact site schematics. By pinning sensor data to custom-named zones—such as a “River Stage” or a “Yellow Food Row”—on the internal festival map, toilets and waste bins can be monitored in their precise geographical context. This level of detail ensures that dispatchers aren’t just sending crews to a generic grid coordinate, but directly to the specific vendor row or stage perimeter where the alert originated, further helping to waste optimize the entire footprint.
Alerts should be configurable: for example, an email or SMS to managers if any restroom queue exceeds a threshold, or if any bin hits 90% full. Mobile apps for crews can push these notifications in real time (a cleaner’s phone can buzz with a task like “Check Restroom Zone B – 80% occupied”). For simplicity, many festivals just use group chats (Slack, WhatsApp) tied to alerts. For example, the Ticket Fairy platform can integrate custom webhooks or third-party services so that IoT alerts become part of a unified communication channel alongside ticket scans or badge scans. A risk here is information overload: avoid too many false alerts. A recommended practice is to set moderate thresholds and test with staff drills beforehand.
Data in Action: Staffing & Logistics
With dashboards running, operations can get creative. Some festivals overlay ticket sales or scan data (time-stamped entries) with IoT data to predict surges: if 500 people entered in 10 minutes, they know the nearest restrooms will fill quickly. Similarly, if a certain stage ends early, surge counters might redirect staff. Running an event is a bit like managing traffic in a city; sensors become traffic signals. A veteran UK festival organizer once joked that their IoT dashboard was like an “air-traffic control screen” for people.
Table: Implementation Timeline (Example)
| Phase | Timeline | Milestones |
|---|---|---|
| Planning | 6-12 months before | Identify needs (toilets/waste/crowd), budget, tech partners. Map sensor locations. |
| Procurement/Test | 3-6 months before | Purchase/rent devices. Conduct lab tests. Set up network on small site. |
| Installation | 1-2 weeks before event | Deploy sensors on-site, calibrate, connect to dashboard. Carry out end-to-end test. |
| Event Live Ops | Day of event | Monitor dashboards constantly. Adjust on-the-fly (open extra toilets, dispatch trucks). |
| Post-Event Review | 1-2 weeks after | Analyze data logs, costs vs. benefits, debrief improvements for next year. |
This timeline shows that deploying sensors is a multi-stage project. Starting early is crucial: many IoT teams recommend at least one dry-run installation (on a smaller campus event or normal building) to refine procedures before the big festival.
Implementation Tips and ROI
Pilot and Scale
For producers new to IoT, start small. Run a pilot at a local event or even a single area of a festival. Use affordable kits (e.g. Arduino-based counters or off-the-shelf PIR sensors) to prove the concept. Once stakeholders see the numbers (like “we spotted a 50-person queue building”), scaling up becomes easier. Many vendors also offer rental models for one-off events, avoiding large CapEx.
As you scale, plan for power and connectivity: lithium batteries and solar panels are helpful. Train staff to check sensors daily (like tech beat-checks). Document all device IDs and locations meticulously (get a GPS tag on each). In adverse weather, ensure enclosures are IP65-rated; condensation and mud are common festival culprits. If using smartphones or tablets as makeshift readers, secure them against theft.
Data Privacy and Ethics
When deploying crowd sensors (especially tracking phones), consider privacy laws. In Europe (GDPR) or other regions, passively collecting device MAC addresses or Bluetooth IDs may require consent. Many events declare in their terms-of-entry that anonymous technical monitoring (for safety) is in use. Avoid capturing personal data: the usual advice is to use only aggregate counts and avoid retaining individual device IDs. Clearly signpost any camera surveillance areas (even if only analyzing heat). Transparency with attendees builds trust and avoids potential legal issues.
Cost-Benefit and Budgeting
Implementing IoT adds to the festival budget, but often a small fraction of the overall operations spend. A quick budget table might look like this (example for a 30k-attendee festival):
| Line Item | Cost (USD) | Notes |
|---|---|---|
| Restroom Sensors (50) | $3,000 | 50 PIR sensors @ $60 each |
| People Counters (10) | $2,000 | 10 beam counters @ $200 each |
| Smart Bin Sensors (30) | $6,000 | 30 ultrasonic sensors @ $200 each |
| Network & Gateways | $2,000 | LoRa gateways, 4G router, SIM fees |
| Dashboard Software | $1,500 | Platform license or custom integration |
| Installation & Labour | $3,000 | Tech crews to deploy sensors and monitor |
| Total | ~$17,500 | ~0.5% of a $3M festival budget (example scale) |
On the benefits side, such an investment can directly pay back through savings. For example, eliminating one garbage truck shift (roughly $1,000) each day and cutting cleaning overtime might recover 20-30% of the cost. More importantly, it prevents PR disasters (viral tweets about nasty toilets or trash), and boosts satisfaction scores. Sponsors and city regulators also love the data: one green sponsor requires proof of waste diversion, which is easily documented with sensor data. Ultimately, experienced producers view IoT as an operational insurance policy: you may not glimpse huge profit in line-items, but you avoid many hidden costs and headaches.
Learning from Failures
No tech rollout is flawless. Some festivals have reported sensors glitching in muddy conditions (hence the waterproofing warnings). Wireless outages (make sure to test on-site frequencies) and dead batteries are common hiccups. One festival found that people tended to disable a bin sensor by placing trash at odd angles – a fix was to use a different sensor placement. Another event learned the hard way that relying solely on tech meant when the network crashed, staff were caught flat-footed. The lesson? Always have manual overrides and keep human eyes on key choke points. Use sensors to complement, not replace, goodwill and judgment.
Frequently Asked Questions About Festival IoT
What smart waste platforms are most reliable for event or stadium use?
For large-scale events and stadiums, reliability hinges on robust connectivity and durable hardware. Platforms like Bigbelly (known for solar-powered compactors) and Nordsense (which offers versatile, easily retrofitted ultrasonic sensors) are highly regarded in the industry. When selecting a platform, prioritize systems that offer cellular or LoRaWAN connectivity, as standard Wi-Fi can become congested during peak festival hours. The most reliable solutions also feature open APIs, allowing you to feed waste data directly into your central operations dashboard.
How do you evaluate the reliability of IoT waste management systems for large venues?
Evaluating the reliability of these systems requires looking at hardware durability, battery lifespan, and network resilience. For stadium use or massive outdoor events, the best platforms utilize independent mesh networks or LoRaWAN rather than relying on standard cellular data, which often fails during peak crowd surges. Additionally, operators should look for platforms that offer predictive analytics to waste optimize their site layout over time, rather than just providing basic full-level alerts.
How do operators map toilets and waste bins on a digital festival dashboard?
Modern event management platforms allow producers to upload custom site schematics directly into their IoT dashboards. By tagging specific geographical markers—such as a “River Stage” or a “Yellow Food Row” on the digital festival map—toilets and smart bins are tracked in their exact physical context. This ensures that when a bin overflow sensor indicator triggers an alert, dispatchers can route sanitation crews to the precise vendor area or stage perimeter, drastically reducing response times and helping to waste optimize the site.
How do you prevent false alerts from a bin overflow sensor indicator?
Preventing false positives requires careful calibration and strategic placement of the hardware. A bin overflow sensor indicator can sometimes be triggered prematurely if a large, lightweight item—like an uncrushed cardboard box or a large promotional cup—blocks the ultrasonic beam near the top of the receptacle. To mitigate this, operators should configure the system to require sustained blockage (e.g., reading “full” for at least five consecutive minutes) before triggering a dispatch alert. Additionally, training vendors and staff to break down boxes helps maintain accurate fill-level readings and allows you to truly waste optimize the collection routes.