From Guessing to Knowing: The Power of Real-Time Ops Dashboards
Imagine running a festival in the old days: the entry gates are backed up and the team only finds out after angry attendees start tweeting. A water station runs dry, but staff notice only once a crowd has already gathered around it. The sound levels at the edge of the venue creep past local limits, risking fines, yet no one in the control center knows it until a neighbor calls to complain. In the heat of the moment, festival organizers had to rely on gut feeling, scattered radio calls, and luck – in other words, a lot of guesswork.
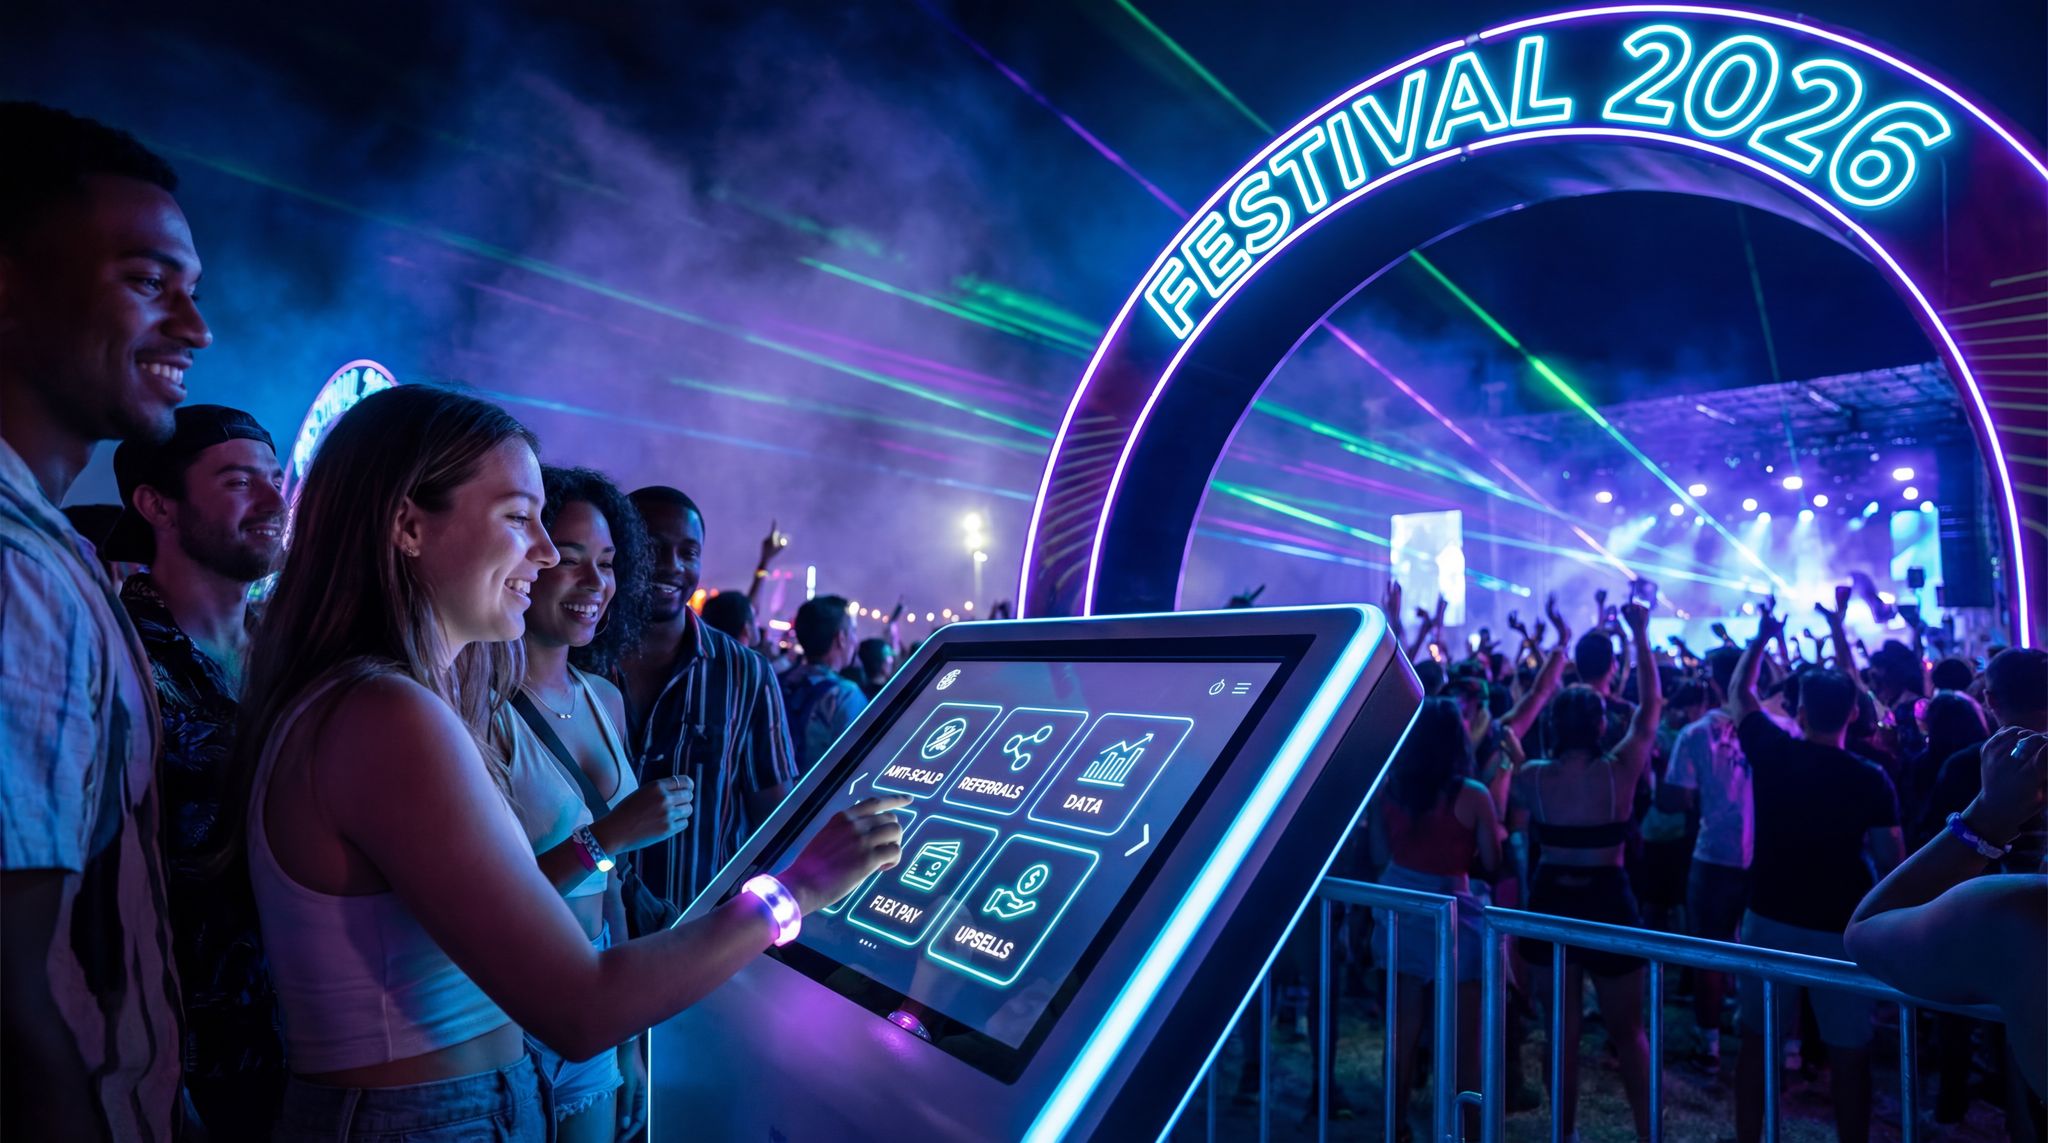
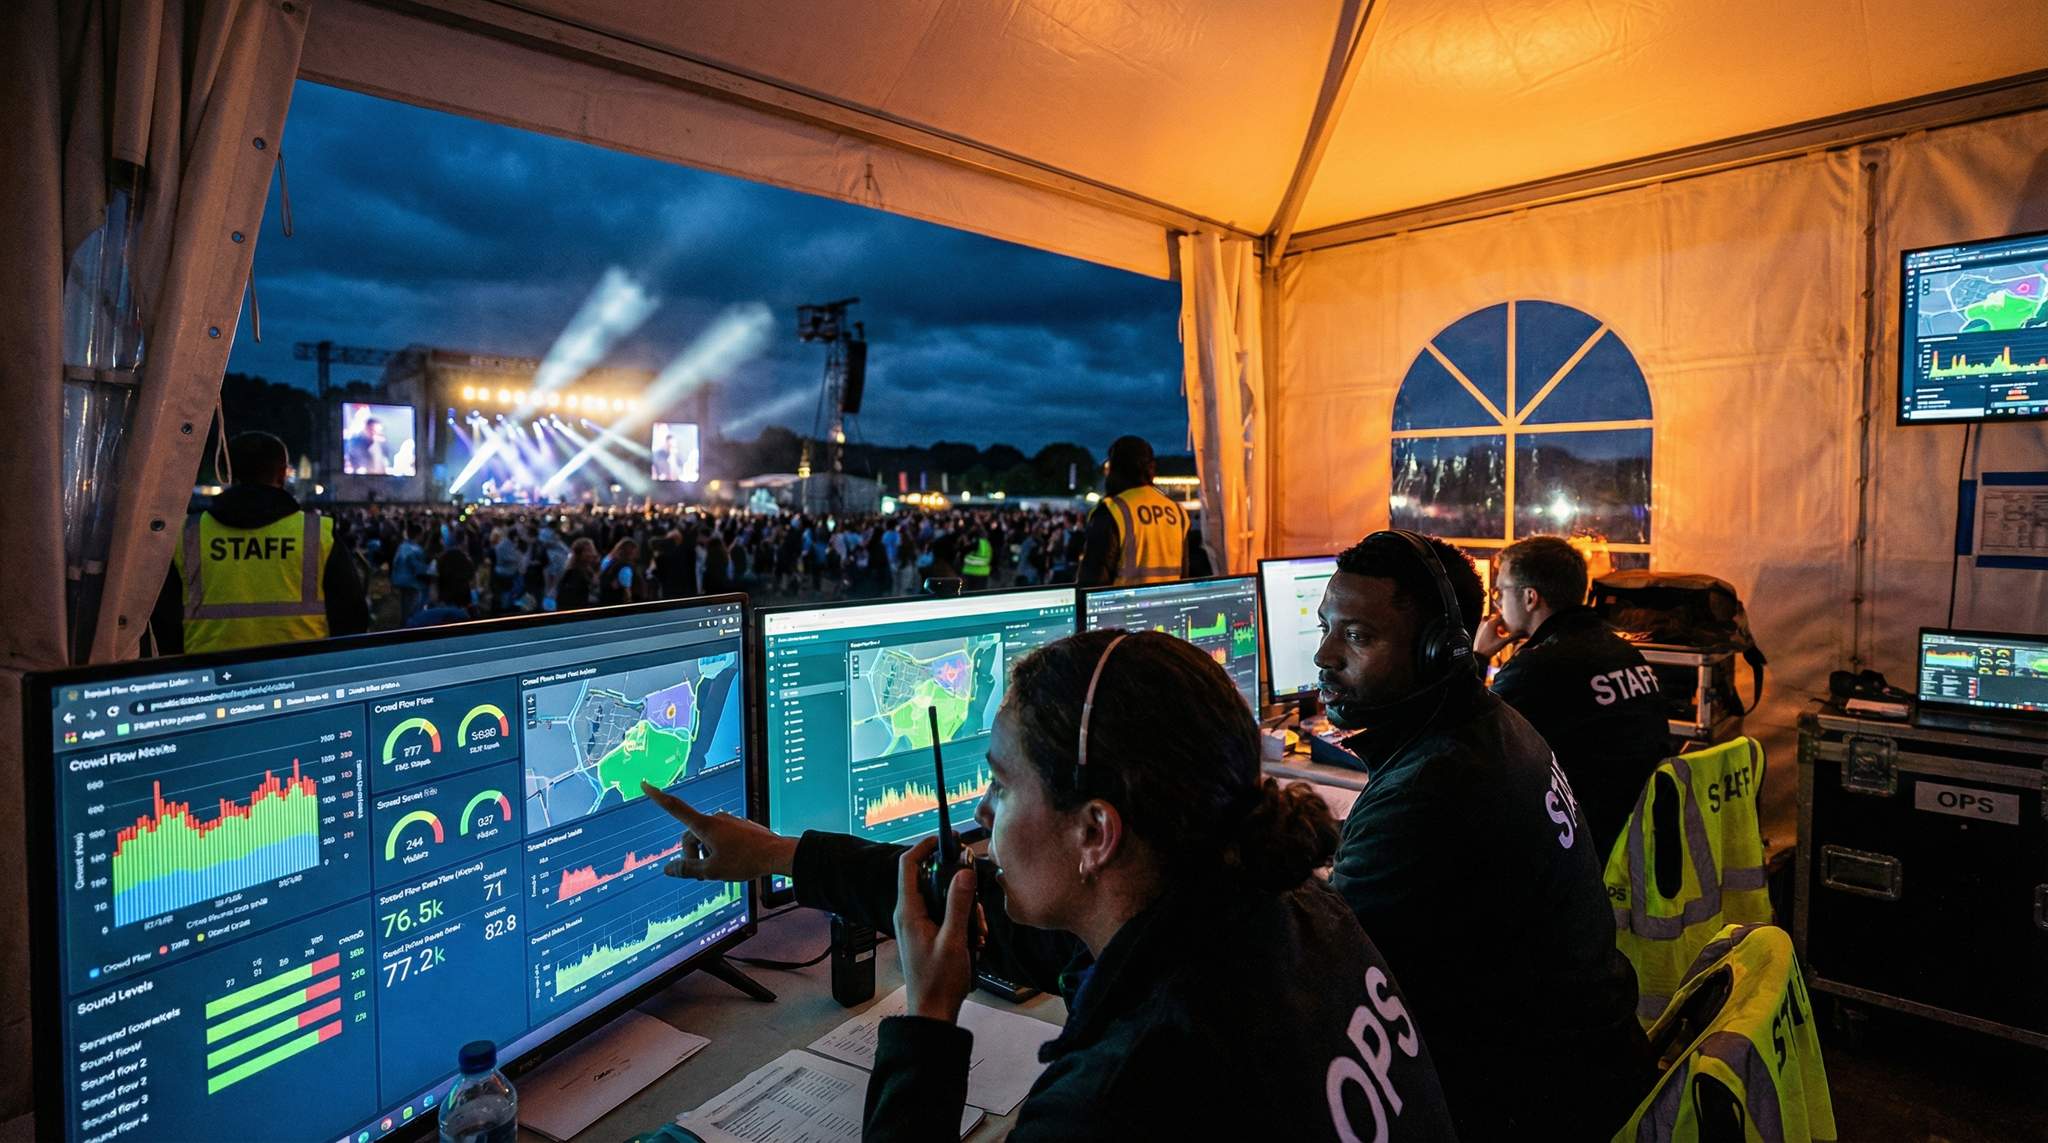
Modern festivals, whether a 5,000-person boutique art fair or a 100,000-strong music extravaganza, can no longer afford to operate blindly. Today’s most successful festival producers have embraced real-time operations dashboards that consolidate live data from across the event. These ops dashboards turn guessing into knowing by streaming critical information – from ticket scans at the gates to queue times, water usage, incident reports, and even sound levels – all into one live overview. Armed with instant insight, decision-makers can respond to issues within minutes (or seconds) instead of hours, dramatically improving safety and attendee experience.
This comprehensive guide shares hard-earned wisdom on implementing and using festival ops dashboards. It draws on lessons from festivals around the world – large and small, music and food, urban and rural – to give practical advice on what to monitor, how to set trigger thresholds that prompt action, ways to share information with stage managers and crew, and how to archive data for after-event analysis. The goal is to help the next generation of festival organizers move from reactive guesswork to proactive, data-driven management.
Key Metrics to Track on a Festival Ops Dashboard
A well-designed festival ops dashboard gathers all the vital signs of your event in one place. What should a festival operations team actually monitor in real time? The exact metrics can vary by event type, but several stand out as universally useful:
Data-Driven Event Marketing
Track ticket sales, demographics, marketing ROI, and social reach in real time. Exportable reports give you the insights to make smarter decisions.
-
Entry Scans & Attendance Counts: Real-time ticket scans show how many people have entered (or exited) the venue. Monitoring entry rates and total attendance is crucial for managing crowd flow and safety. If your ticketing platform (for example, Ticket Fairy) provides live attendance data, make sure it’s on your dashboard. Knowing that 20,000 out of 25,000 ticket holders are already inside by 4 PM, for instance, tells a festival producer a lot about peak crowd timing and whether more gate staff are needed. At major festivals like Glastonbury in the UK or Coachella in the US, the operations center keeps a constant eye on entry numbers to anticipate congestion and prevent bottlenecks at the gates.
-
Queue Times at Entrances & Key Attractions: Beyond raw entry counts, understanding how long people are waiting is key. A gate might be processing 50 people per minute, but if 5,000 people arrived at once, the queue length and wait time could still become excessive. Modern festivals use tools like timed scan data or even Wi-Fi/Bluetooth tracking to estimate queue lengths at entrances, food stalls, merch booths, or shuttle bus stops. For example, a festival in Singapore implemented a simple system where staff at entry gates pressed a button each time 100 people entered, feeding a live graph of waiting times. When average wait crossed a threshold (say 20 minutes), it signaled the need to open more lanes or deploy more staff. By tracking queues on a screen, festival organizers can redistribute resources before frustration turns to social media complaints.
Planning a Festival?
Ticket Fairy's festival ticketing platform handles multi-day passes, RFID wristbands, and complex festival operations.
-
Water Usage & Supply Levels: At an outdoor summer festival, water is as critical as electricity. Tracking water usage in real time helps ensure attendees stay hydrated and facilities keep functioning. Some events install flow meters on water refill stations and water tanks, which report how many liters are dispensed over time. A spike in water usage (e.g. lots of people refilling bottles during a heatwave) will show up on the dashboard. If one water station is being overrun with demand, operations can quickly send additional water supplies or redirect attendees to other stations via signage and announcements. For instance, at a large camping festival in Australia, the ops team monitored tank levels across the site; when the dashboard indicated one area’s tanks were at 10% capacity, water trucks were sent to refill them before taps ran dry. This not only avoids attendee distress but also prevents potential health and safety incidents. Even at small festivals, simply having staff report water stock levels by radio to a central person updating a spreadsheet (a low-tech dashboard) can make a big difference.
-
Incident Reports (Security & Medical): Every festival has an incident log – security issues, lost children, medical emergencies, minor injuries, facility problems, and so on. In the past, these might be written in a notebook or passed around on walkie-talkies. An ops dashboard can integrate incident reporting systems so that as soon as an incident is reported by security or medical teams, it pops up for the central command to see. Many large-scale events use software where team members in the field submit incident tickets via mobile devices, which then appear on a live incident list for commanders. If multiple medical calls come from Stage Two within 10 minutes, the ops dashboard will reflect that cluster immediately – enabling leaders to dispatch extra medics or temporarily slow down the show if needed. Case in point: a festival in Germany noticed a rash of heat-related illnesses one afternoon; seeing the pattern on their dashboard, they alerted stage managers to mention hydration to the crowd and opened extra water faucets. The ability to visualize all ongoing incidents (with location and status) in one place ensures nothing gets overlooked and response can be coordinated efficiently.
-
Sound Levels at Perimeter (“Sound Edges”): One of the trickiest aspects of outdoor festivals is managing sound. Local residents and authorities often have strict limits for noise beyond the festival grounds. Ops dashboards can receive feeds from sound level meters placed at the festival’s perimeter (the “sound edges”) and near stages. Monitoring live dB (decibel) readings helps the team ensure stages don’t exceed permitted levels. For example, at a festival in France, noise sensors in neighboring villages stream data to the ops center; if the low-frequency bass from the EDM stage starts creeping above the agreed limit, an alert is displayed. The audio engineers can then trim the sound levels (especially bass frequencies) or reorient speakers slightly. Keeping sound under control in real time avoids fines, keeps the local community happier, and prevents regulatory problems that could jeopardize the festival’s future. It also means the festival doesn’t have to rely solely on after-the-fact complaints to gauge impact – the data is right there live.
-
POS Systems and Revenue Collection: For modern promoter ops, tracking the financial pulse of an event is just as critical as monitoring crowd safety. Integrating data from point-of-sale (POS) systems deployed at music events allows organizers to visualize real-time revenue collection across bars, food vendors, and merchandise tents. By leveraging these data management technologies, a promoter can see exactly which bars are underperforming or where inventory is running low. If a specific merch stand is breaking sales records, operations can immediately dispatch runners to restock popular items, maximizing profitability while the gates are still open.
Boost Revenue With Smart Upsells
Sell merchandise, VIP upgrades, parking passes, and add-ons during checkout and via post-purchase emails. Increase average order value by up to 220%.
-
Live Ticket Sales & VIP Upgrades: Beyond just scanning people in, a comprehensive event ticketing analytics portal allows promoters to monitor last-minute sales surges and VIP upgrade conversions in real time. If your organizer dashboard shows a sudden spike in VIP tier purchases on Saturday afternoon, operations can quickly allocate more staff to the premium entry lanes and exclusive bar areas. Tracking these revenue-driving metrics ensures that high-value attendees receive the seamless experience they paid for, while maximizing on-site monetization.
Each of these metrics provides a piece of the puzzle. Together, on one screen (or a set of screens), they give a holistic live picture of the festival’s health. Some other metrics that organizers might include are weather conditions (for example, temperature and wind, since an approaching heat spike could drive up water usage, or a wind change might carry sound further), crowd density in different zones (if using cameras or Wi-Fi data to estimate crowd numbers in an area), and even social media sentiment (to catch public safety rumors or complaints early). The key is to choose metrics that matter for your event’s size and type, and ensure they update in real time or near-real time.
Need Festival Funding?
Get the capital you need to book headliners, secure venues, and scale your festival production.
Defining Thresholds That Trigger Action
Having a sea of data on a dashboard is not enough – the real power comes from defining what values should prompt the team to do something. Effective festival operations dashboards pair each metric with clear thresholds or triggers that have pre-planned responses. This way, the moment data crosses a certain line, the team already knows what action to take.
Consider these examples of thresholds and actions:
-
Queue Time Thresholds: Decide on a maximum acceptable wait (for example, 15 minutes at ticket scan, 10 minutes at water refill, 5 minutes at toilets). If the dashboard’s queue metrics show waits exceeding those targets, it’s a trigger to act. The action could be: open additional entry lanes, call in more volunteers to the busy water station, or dispatch cleaning crews to fast-track toilet turnover. The thresholds should be set based on both attendee comfort and safety. A festival in Mexico City found that when entry wait times went beyond roughly 20 minutes, customer satisfaction plummeted for the rest of the day – a lesson that informed their 15-minute trigger point to keep morale high.
-
Attendance Density & Area Capacity: For festivals with multiple stages or zones, you might set a threshold like “80% of area capacity” as the point to regulate crowd flow. If live attendance counts or crowd density sensors show a particular zone (say the smaller Stage B tent) is getting close to full, security can temporarily halt entry to that area or direct people elsewhere. This prevents dangerous overcrowding. Many large festivals – from New Zealand to India – use a color-coded crowd density map on their dashboards; if a zone turns red, it indicates a threshold breach and staff start metering the entrances to that zone (one-in-one-out or diverting foot traffic).
-
Water Supply Levels: Establish a minimum water level for tanks or an acceptable range for usage rates. For instance, if any water tank’s level drops below 20% capacity, that could trigger an immediate refill request or activation of backup water supplies. Or if a particular free water station is serving more than, say, 100 liters per minute (indicating heavy usage), it might trigger a push notification to attendees about additional water points with shorter lines. At a famous desert festival in Nevada, ops dashboards monitor each water depot; hitting the low threshold automatically alerts the logistics team’s phones to refill it before attendees start complaining of empty taps.
-
Incident Volume: Define what constitutes an unusual cluster of incidents. For example, more than 3 medical calls in 10 minutes in one zone, or any security incident rated severe/critical. Crossing that line triggers escalations: dispatching a supervisor to the scene, making an announcement to calm the crowd, or even pausing a performance if multiple incidents signal something’s wrong (like a crowd crush risk or a bad batch of something causing illnesses). Sticking to procedures is crucial – at one UK festival, a series of small fights broke out near the main stage. The dashboard flagged five security alerts in under 30 minutes in that area; this met the pre-set threshold to stop the music temporarily. The pause and voice-of-God announcement to step back and stay calm helped diffuse the tension. Only with data could they justify such a drastic move quickly.
-
Sound Level Limits: Set dB thresholds at the perimeter (usually dictated by local permits, e.g., “Max 65 dB(A) after 11 PM at the nearest house”). If the noise monitor on the dashboard goes into the warning zone (approaching the limit), the action might be to have the audio technician reduce the volume by a certain number of decibels or cut specific frequencies. Similarly, many events set internal sound thresholds for health & safety (for staff hearing protection or audience comfort). The dashboard might show if any stage’s output exceeds, say, 105 dB near the front-of-house sound desk, triggering an alert to the audio team to dial it down slightly. Having these clear rules avoids the chaos of debating what to do under pressure – the team already agreed on the plan during pre-production.
The process of defining thresholds should involve input from all relevant departments: security, medical, production, logistics, and even local authorities if needed. It’s essentially an extension of the festival’s risk management plan: “If X happens, we will do Y.” By visualizing X (the metric) in real time, you ensure Y (the response) is triggered at exactly the right time. The thresholds should also be tested and adjusted – you might discover after Day 1 of the festival that your wait time threshold was too generous or too strict and tweak it for Day 2.
Remember, thresholds aren’t just for emergencies or negatives. They can also highlight opportunities. For example, if live merchandise sales data (if integrated into your dashboard) shows a spike at one booth, you could proactively deploy more staff there to capitalize on demand. The main point is to translate data into defined actions.
Aligning the Team with Shared Data
A dashboard is only as good as the people using it. It’s crucial to ensure that the insights it provides are shared in the right form with the right staff, so everyone’s decisions align. In the middle of a festival, miscommunication between departments can lead to conflicting actions. A simplified, shared view of key data keeps the entire team on the same page.
How might this work in practice? The central operations team might have a comprehensive dashboard with dozens of metrics and alerts – essentially the nerve center of the festival. However, individual team leaders (like stage managers, security chiefs, the site manager, etc.) could have tailored, simplified dashboards that show the essentials relevant to their role:
-
Stage Managers: A stage manager doesn’t need to see every medical call on the grounds, but they do need to know if their stage is affected by an issue. Providing them a pared-down dashboard view – for instance, showing crowd count or capacity at their stage, any active incident in their immediate area, and a simple traffic-light indicator of the sound level versus the limit – can be invaluable. If the festival ops center decides to lower the volume at Stage X by 2 dB because the noise threshold was crossed, the stage manager sees the same alert and understands why. This alignment prevents situations where, say, a stage manager might otherwise think “Why is HQ asking us to turn down?” By sharing the data, everyone buys into the decision.
-
Security and Medical Teams: These teams often already have their own radio channels and reporting, but a shared digital view helps them collaborate. A security lead viewing the live incident dashboard can see, for example, that the medical team has four ongoing cases (perhaps visible as four pins on a festival map or four list entries) on the west side of the venue. They might decide to shift some security staff there preemptively. Conversely, if security notices a developing crowd issue, they can alert others through the system and that warning appears for medical and ops managers too. Unified data views cut down on the time spent relaying messages, and ensure that all departments respond based on the same information.
-
Site Operations (Logistics): The site ops manager might focus on utilities and infrastructure metrics. They could have a custom view tracking things like water levels, generator fuel levels, and even trash collection status. If water usage spikes at a particular end of the site, the site ops lead sees it and can deploy runners or maintenance crew accordingly. By giving them direct access to this slice of the dashboard, they don’t need to wait for a call from central command – they can act immediately and then simply radio in that it’s being handled.
-
Gate Managers and Guest Services: The front-of-house team lives and dies by crowd flow. By receiving automated queue wait-time alerts directly to their devices, gate managers can instantly react to sudden influxes of attendees. If a notification flags that the VIP entry line has exceeded a five-minute wait, they can immediately reallocate staff from general admission or update digital signage to redirect fans, preventing minor delays from escalating into major crowd control issues.
The technology to achieve shared views can range from specialized event ops software to something as simple as a shared Google Sheet or a messaging app. At a smaller festival in Indonesia, organizers used a private WhatsApp group to post periodic key stats (attendance count, next hour’s weather, any major incidents) so that stage crews and vendors were in the loop without needing the full dashboard app. Larger festivals might equip key staff with tablets running a secure dashboard web page or app, possibly with different permission levels for different views.
The cultural shift here is just as important as the tech: encourage a data-driven culture among the festival staff. When everyone trusts and references the live data, there’s less room for rumors or individual biases to cause friction. It also empowers team members – a stage manager who can see the crowd count at their stage knows when they might need to ask for gate control, without waiting for someone to tell them. In effect, sharing the dashboard (appropriately) turns the whole team into an interconnected unit, rather than isolated departments.
Finally, don’t forget to brief all teams on the dashboard’s meaning before the festival. A quick orientation for stage managers and others on how to read the alerts or indicators ensures that in the heat of the moment, they interpret everything correctly. Clarity is key – if you use a color code (green/yellow/red) for thresholds, make sure everyone knows what red means for them (“red = action needed: prepare to pause the show”, etc.). With preparation and the right tools, the entire festival crew becomes faster and more synchronized in their decision-making.
Archiving Data for Debriefs and Future Planning
When the music’s over and the crowds have gone home, the work isn’t truly finished – it’s debrief time. One of the greatest advantages of a digital ops dashboard is that it automatically logs vast amounts of operational data that was previously lost to fleeting radio chatter. Archiving this data and analyzing it post-event is a goldmine for improving future festivals and satisfying stakeholders like sponsors, local authorities, and partners.
Here’s how saving and reviewing dashboard data can benefit festival organizers:
-
Post-Event Debriefs: In the days or weeks after the festival, your team will likely hold debrief meetings to discuss what went well and what didn’t. Hard data makes these debriefs far more productive. Instead of vague memories, you can pull up graphs and logs: e.g., “On Saturday, Gate 1 wait times spiked to 30 minutes at 2 PM – and the dashboard shows that it lasted about 45 minutes until we opened Gate 3 and brought it down to under 10 minutes by 3 PM.” With that evidence, the team can examine why the line built up in the first place and how the response could be faster next time (maybe opening Gate 3 earlier). Similarly, incident logs might reveal patterns like “Most of our medical incidents happened after sunset at the EDM stage”, prompting ideas such as increasing lighting or patrols in that area next year.
-
Reporting to Authorities and Sponsors: Many festivals are required to submit reports to city officials or licensing authorities documenting compliance with safety and noise regulations. If your dashboard archived sound levels throughout each day, you have concrete proof that you stayed under limits (or if there were minor breaches, you can pinpoint when and show the quick corrective action taken). This data-driven accountability builds trust with regulators. Sponsors also love to see impact reports – for example, if you can tell a beverage sponsor exactly how many water refills were done at their branded water stations, that demonstrates engagement. Using real numbers from the ops dashboard can make your post-event reports sing and set you apart as a professional, transparent festival producer.
-
Year-on-Year Improvements: If this isn’t a one-time festival, the data archive becomes part of your planning toolkit for the next edition. Over multiple years, you might notice, for instance, that Day 2 between 1-3 PM consistently has the highest bar queues and water usage. That insight can drive scheduling more staff during those hours, or adding another water station ahead of time. Or you might find that a particular entrance always has slower processing – maybe due to layout – prompting a redesign of that gate. Without solid data, organizers often rely on anecdotal feedback which can be skewed by the loudest opinions. The archive tells the true story of operations. Some festival teams even create a “dashboard replay” – a time-lapse visualization of how the crowd arrived, moved, and left, synced with incidents and actions. Watching that in a debrief can reveal subtle factors (like how a slight weather delay affected entry rush) that you’d otherwise miss.
-
Training and Scenario Planning: Archived data can also be used to train new staff or simulate situations. You can show new volunteers, “This is what the entry graph looked like last year when gates opened – see how quickly 10,000 people showed up. That’s why we need all hands on deck early.” Or you could pose a scenario in a training workshop: “Here’s a printout of an hour where sound levels were flirting with the limit and medical calls spiked – what would you do?” By analyzing real past data, teams become more prepared to handle the future, because they have a reference for what “normal” versus “problem” conditions look like.
From a technical perspective, archiving can be as simple as exporting CSV files of each metric by time, saving screenshots of the dashboard at peak moments, or as advanced as maintaining a database or cloud storage of all sensor data. The important part is to ensure it’s stored safely (and securely, especially if it contains sensitive incident info) and organized so it can be retrieved later. Too often, valuable data is lost because no one backed up the system after the festival. Make it a routine part of the shutdown process: export and save all dashboard data. Ticket Fairy’s analytics, for example, allow event organizers to retain their event reports – those can complement operations logs to give a full picture.
Scaling Dashboards for Any Festival
It’s easy to think that all this technology and data is only for giant festivals with huge budgets, but that’s not true. Dashboards can be scaled to the scope of your event. The principles of “knowing instead of guessing” apply whether you have 500 attendees or 50,000. Here are some considerations for different scales:
-
Small Festivals & Community Events: You might not have high-tech sensors everywhere, but you can still create a rudimentary ops dashboard. Use your ticketing platform’s live attendee count to see how many people are on-site. Have volunteers report approximate queue lengths via walkie-talkie or SMS to a coordinator who updates a shared sheet. Use a handheld decibel meter at the boundary and periodically log readings. Even manually updating a whiteboard in the command tent with these figures is a form of real-time dashboard! The key is that everyone knows to check that board (or WhatsApp group, or spreadsheet) regularly. For example, a community food festival in Toronto used a Google Sheets dashboard accessible on phones to track vendor line length updates and stock levels of water and first-aid supplies. It cost almost nothing but still informed the team’s decisions throughout the day.
-
Large Festivals & Multi-Day Mega Events: Here, investing in integrated systems pays off. Dedicated event management software or custom dashboards can pull in streams from RFID entry scans, CCTV analytics, sensor networks, and incident management apps seamlessly. At massive music festivals like Tomorrowland (Belgium) or Sunburn Festival (India), organizers set up a central Operations Control Room akin to a “mission control”. Wall-to-wall screens show various dashboards: crowd heatmaps, entry throughput graphs, weather radars, you name it. These festivals often have tech partners or in-house innovation teams to build sophisticated dashboards, sometimes even powered by AI predictions (like forecasting where crowds will flow next). While not every event needs that level of complexity, it’s inspiring to see what’s possible. The core lesson from the big leagues is: dedicate personnel to monitor the data. Big festivals often have at least one person solely as the “Dashboard Operator”, calling out alerts as they happen so other managers don’t miss them in the frenzy.
-
Different Types of Festivals: The focus of your ops dashboard might change depending on the event genre. A food and wine festival might emphasize metrics like vendor inventory or line length at popular chefs’ stalls. A marathon or sporting event’s “festival area” might track how many runners have passed certain checkpoints (something a platform like Ticket Fairy can integrate if it handles registrations). A multi-stage music festival will prioritize crowd distribution and sound. In any case, tailor your dashboard to the event’s priorities. For example, a film festival in Italy used a dashboard to coordinate theater capacities and shuttle bus readiness between venues – their key metric was seats filled vs. available, updated in real time as moviegoers scanned tickets at each cinema. The lesson is that the ops dashboard concept is flexible: choose the data that defines success and safety for your event.
-
Budget Considerations: You don’t need to blow the budget on this if you plan smartly. Utilize existing infrastructure where possible. Your ticketing system’s scanning app (like Ticket Fairy’s mobile scanner) provides crowd entry data without extra cost – leverage it. Free or low-cost tools (shared docs, survey apps, open-source IoT platforms) can sometimes be stitched together to create a custom solution. If you do invest in a professional dashboard software, make sure it’s something you can reuse for future events or across multiple events you run, to maximize ROI. Sometimes local universities or tech startups might even be eager to pilot a new crowd tech at your festival if you approach them – that can be a win-win to get cutting-edge tools at low cost.
-
Leveraging Built-In Ticketing Analytics: Before investing in expensive custom software, look at the tools you already use. A robust ticketing platform analytics dashboard for organisers often serves as the perfect foundational ops screen. Platforms like Ticket Fairy provide live demographic breakdowns, real-time check-in velocity, and sales spikes that directly inform promoter ops decisions. By utilizing these built-in data management technologies, even independent promoters can access enterprise-level insights without the enterprise price tag.
At the end of the day, the size of the festival doesn’t matter as much as the mindset. Commit to being data-informed. Even a little bit of real-time info can save you from a big headache. And as your event grows, you’ll already have the culture and basic systems in place to build a more elaborate dashboard gradually.
Frequently Asked Questions
What metrics should a festival operations dashboard track?
A well-designed festival ops dashboard monitors critical real-time data including entry scans for attendance counts, queue times at entrances, and water usage levels to ensure hydration. It also tracks incident reports from security and medical teams, alongside sound levels at the venue perimeter to maintain compliance with local noise regulations.
How do trigger thresholds work in festival management?
Trigger thresholds act as pre-planned values that prompt immediate operational responses when crossed. For example, if queue times exceed 15 minutes or water tanks drop below 20% capacity, the dashboard alerts the team to open more lanes or dispatch refill trucks. This converts raw data into proactive safety and service actions.
Why is monitoring sound levels at the festival perimeter important?
Monitoring sound levels at the “sound edges” ensures festivals stay within local noise limits and avoid fines. Real-time decibel feeds allow audio teams to immediately trim volume or bass frequencies if levels approach the legal threshold, preventing regulatory issues and complaints from neighbors while maintaining the event’s license for future years.
How does sharing dashboard data assist festival stage managers?
Providing stage managers with simplified dashboard views aligns decision-making across the event. When managers see live alerts regarding crowd capacity or sound limit breaches, they understand the context behind requests to lower volume or pause admission. This shared visibility reduces miscommunication and ensures all departments coordinate efficiently during critical moments.
Why is archiving festival dashboard data important for future planning?
Archiving operational data transforms post-event debriefs from anecdotal discussions into evidence-based analysis. Reviewing historical logs of queue spikes, incident clusters, and resource usage helps organizers identify specific patterns to improve staffing, layout designs, and safety protocols for future editions, while also providing proof of compliance to local authorities.
Can small festivals implement real-time operations dashboards?
Small festivals can effectively use ops dashboards by leveraging low-cost tools like shared spreadsheets, messaging apps, or whiteboards. Organizers can manually log key metrics such as queue lengths, water stock, and ticketing app attendance counts to maintain situational awareness and make data-driven decisions without requiring expensive, enterprise-level software infrastructure.
How do promoter ops teams use ticketing and POS data during an event?
Promoter ops teams rely on ticketing platform analytics dashboards for organizers to monitor live entry velocity and remaining ticket inventory. Simultaneously, integrating data from POS systems deployed at music events allows them to track real-time revenue collection and inventory levels. This combined data management technology ensures promoters can maximize on-site sales, restock busy bars, and adjust staffing dynamically based on actual purchasing behavior.
What features make a ticketing platform analytics dashboard effective for event organizers?
An effective ticketing platform analytics dashboard for organisers should provide real-time check-in velocity, live demographic breakdowns, and instant sales tracking. These features allow promoter ops teams to monitor last-minute ticket purchases, track VIP upgrades, and anticipate crowd flow, turning raw ticketing data into actionable operational insights.
How do automated queue wait-time alerts improve festival operations?
Automated queue wait-time alerts notify promoter ops and gate managers the moment line durations exceed pre-set thresholds. Instead of manually monitoring dashboard graphs, staff receive instant pings via SMS or push notification, allowing them to rapidly deploy additional ticket scanners, open new lanes, or update digital signage before bottlenecks compromise the attendee experience.