Introduction
At a bustling beer festival, every pour and every queue tells a story. Successful festival organizers use operations analytics to listen to these stories in real time. By tracking data like pours per tap, keg depletion rates, and queue lengths, event teams can make swift adjustments that keep the beer flowing and attendees smiling. This data-driven approach turns chaos into a well-orchestrated experience – whether it’s a local craft beer fair in Canada or a massive international festival in Germany. Armed with these insights, festival producers can also refine future events and even share valuable stats with breweries to prove the event’s worth.
Tracking Pours per Tap and Keg Yield
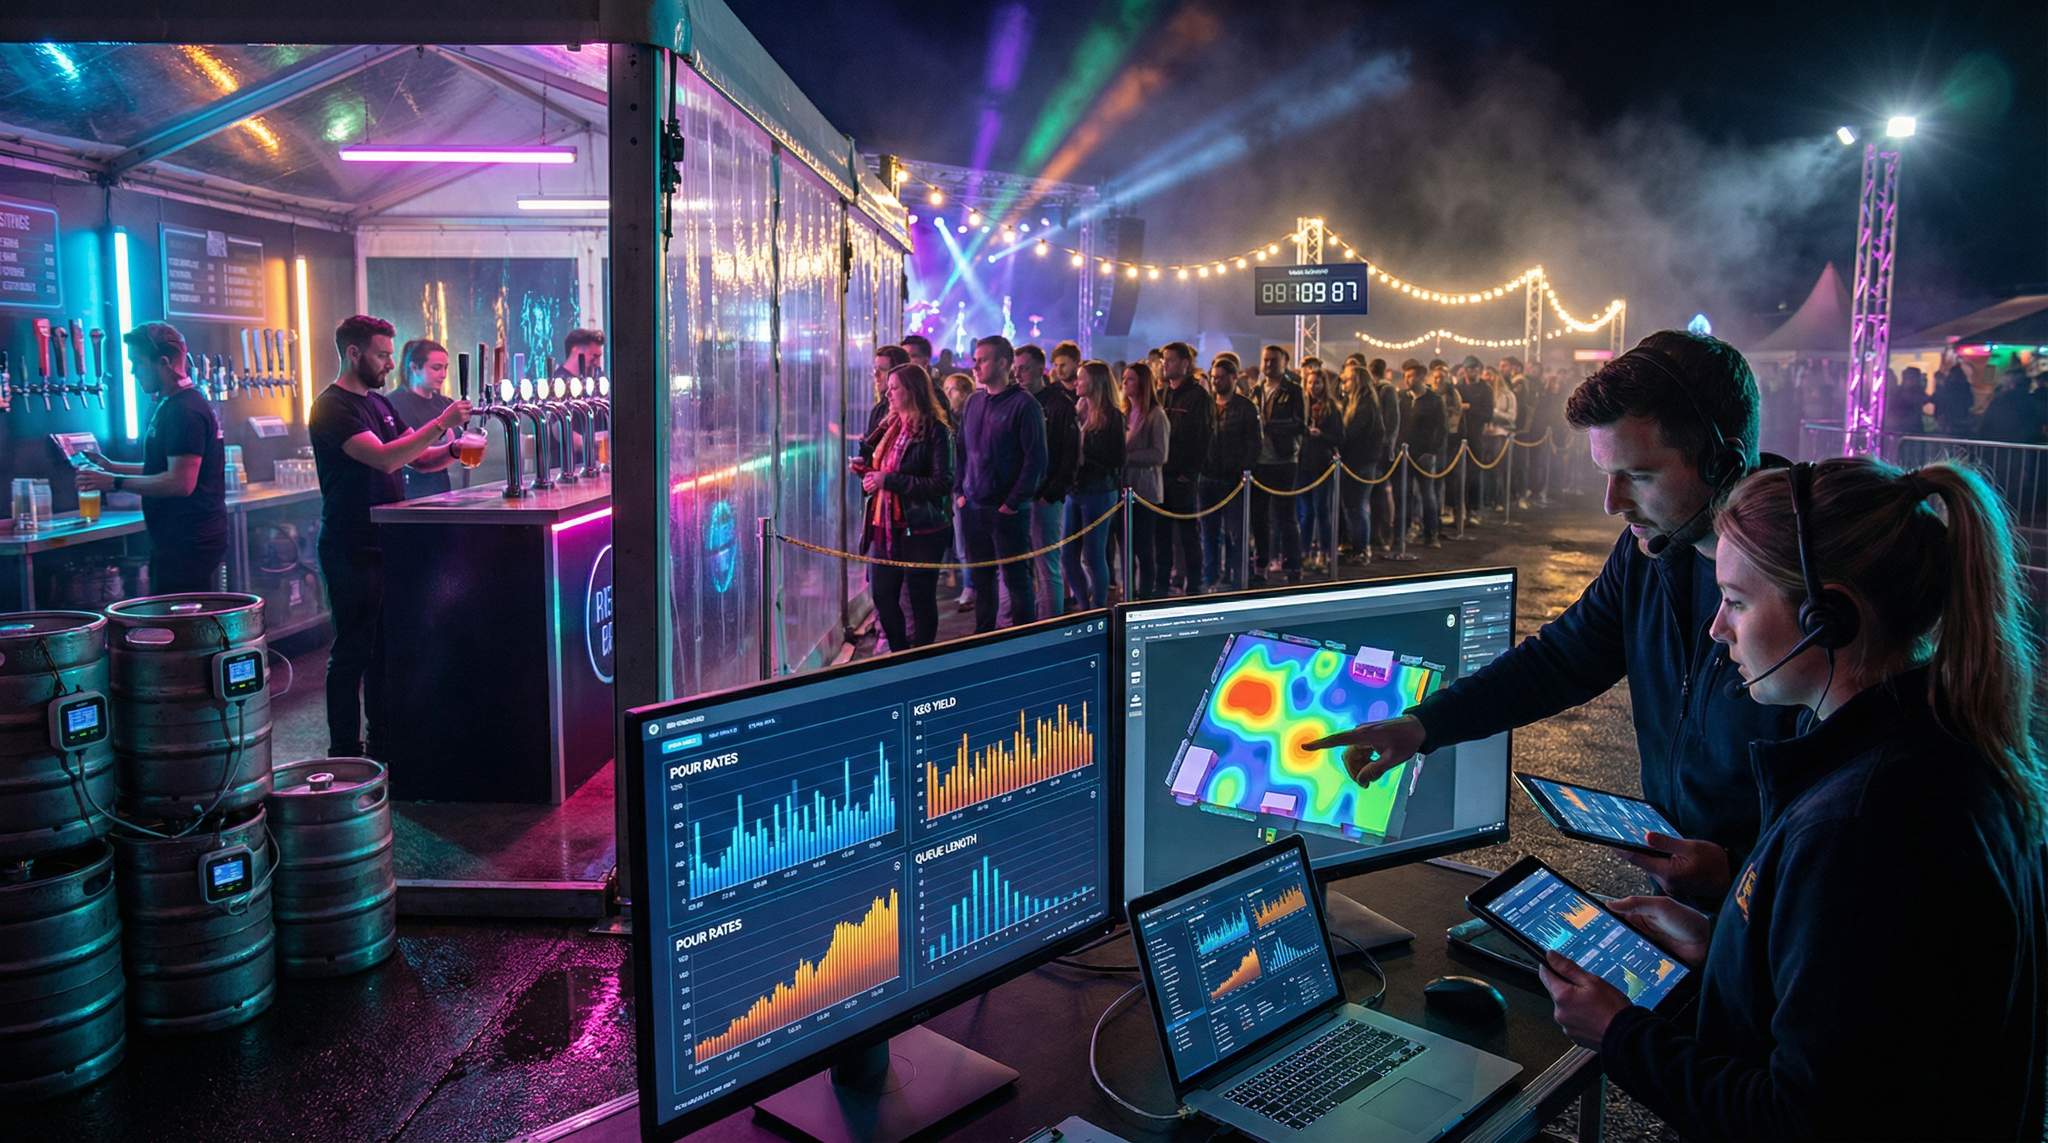
An experienced festival producer treats each tap as a vital data point. Monitoring pours per tap in real time shows which beers are most popular and which might be lagging. Traditionally, most festivals haven’t tracked individual pours in detail, but tracking consumption trends by beer type can unlock powerful insights. For example, if a particular IPA keg is emptying faster than all others, organizers can prepare a backup keg or redirect thirsty attendees to similar brews before disappointment strikes. Ensuring a high yield from each keg is equally important – consistent pour sizes and good foam management mean more servings per keg and less waste. Simple tactics like using marked pour lines on cups or digital flow meters help maximize each keg’s yield. By closely tracking keg depletion rates (how quickly each keg drains), the team can proactively rotate stock – swapping in fresh kegs at just the right moment so no tap runs dry during peak times. In hot climates such as Mexico or India, a fast-draining keg also means ice is melting quickly, so data from these taps signals the ice runners to hustle over with fresh ice. The goal is to never let a popular tap go offline; a well-monitored tap keeps glasses full and customers happy.
Queue Telemetry and Proactive Staff Deployment
Few things dampen a festival vibe like long lines for beer. That’s why leading festival organizers monitor queue lengths as closely as they do kegs. Queue telemetry can be as simple as staff reports or as high-tech as sensors and crowd counting apps, but the key is to know when and where lines are building up. With that intel, the operations team can redeploy staff and resources on the fly. If the stout tent in an Australian beer festival suddenly has a 50-person line while the cider booth is quiet, volunteers from the cider side can be sent to assist at the stout tent. Real-time data helps identify these bottlenecks quickly, often utilizing RFID tags for a safer environment. In one regional beer festival, pinpointing heavy traffic time slots allowed management to reassign staff more efficiently and even stagger special tappings, resulting in a 25% boost in customer satisfaction, demonstrating the significant benefits of data dictionaries. Proactively opening an extra serving station or roving “beer runners” with pitchers can also alleviate long waits. By keeping an eye on queue metrics, festival teams ensure no section of the event is overwhelmed. This on-the-spot agility keeps lines moving and prevents frustrated attendees – whether at a boutique tasting event in New Zealand or a giant Oktoberfest celebration in Munich.
Optimizing in Real Time: Redeploying Staff and Ice
Operations analytics isn’t just about the beer – it’s about the people and infrastructure supporting the beer. When data shows certain taps working overtime, it’s a cue to redeploy staff to those hot zones. A well-trained crew should be flexible; one minute they might be handing out tasting glasses at the entrance, and the next they’re jumping behind a busy bar to pour beer when a surge hits. This fluid teamwork, guided by live data, stops minor issues from snowballing. Similarly, analytics guide the distribution of supplies like ice and cups. If one quadrant of a festival (say, the section with many high-ABV stouts) is churning through ice faster than expected, the data (high pour counts and keg changes) will alert the logistics team to send extra ice before things warm up. Major festivals plan ice supply meticulously – for context, the Great American Beer Festival in the US prepared about 250 tons of ice for its thousands of attendees, a scale that requires managing thousands of different beers served. On a smaller scale, even a regional festival in Singapore can use consumption data to predict when to refresh ice at each booth. By using these analytics to anticipate needs – more staff here, more ice there – organizers prevent service slowdowns. The result is a smoother experience for attendees and less stress for everyone working the event.
Data-Driven Event Marketing
Track ticket sales, demographics, marketing ROI, and social reach in real time. Exportable reports give you the insights to make smarter decisions.
Mastering these real-time adjustments is the cornerstone of effective beverage festival logistics. When an event expands beyond a single style of drink to include cider, wine, or ready-to-drink (RTD) cocktails, the logistical complexity multiplies. Organizers must coordinate diverse supply chains, ensuring that specialized glassware, specific garnishes, and varying ice types are routed to the correct vendor tents precisely when needed. By relying on centralized telemetry rather than guesswork, production teams can seamlessly manage the intricate logistics of a multi-beverage event, keeping every vendor fully stocked and operational regardless of sudden shifts in crowd preferences.
Post-Event Data: Refining the Mix, Layout, and Capacity
The benefits of operations analytics don’t end when last call is over. All the data gathered – from total pours per brewery to peak queue times – becomes a roadmap for refining future festivals. Smart festival producers analyze which beers or vendors had the highest demand and which had lower uptake. This helps in fine-tuning the beer mix for the next event. If IPA brews consistently kicked their kegs early while a porter barely emptied half, the team knows to adjust order quantities or encourage brewers to bring more of the crowd favorites. Data might show that certain styles (for instance, lighter lagers in the afternoon session) were more popular earlier in the day, shifting toward heavier stouts in later sessions – valuable insight for scheduling special releases or announcements at just the right time.
Planning a Festival?
Ticket Fairy's festival ticketing platform handles multi-day passes, RFID wristbands, and complex festival operations.
Layout and placement can also be improved using the data. Heat maps of crowd movement or simply noting where the longest lines were can inform a better booth layout. Organizers often ensure that hugely popular breweries are spaced out across the venue, rather than clumped together, to avoid congestion. Perhaps at a UK festival, the cluster of local London breweries drew most of the crowd to one side of the hall – next time, spreading them out will balance foot traffic. In outdoor festivals in places like Canada or France, data might reveal that attendees flocked to shaded beer garden areas during the afternoon; putting a couple of popular taps near those areas could elevate sales and satisfaction. Also, identifying a “dead zone” (an area that saw low traffic) might indicate poor signage or an unlucky placement – something to fix in the layout for next time.
Another critical lesson from data is adjusting session caps and timing. Many large festivals split attendees into multiple sessions (day vs. evening, or VIP hour vs. general session) to control crowd size. If analysis shows that the evening sessions in an Indian craft beer fest had consistently longer waits than the afternoon, it may be a sign to reduce the ticket cap for those sessions or add another pouring station during that time. Conversely, if a morning session in Spain had lots of leftover beer and crew downtime, perhaps a slightly higher cap or combined sessions could be feasible. With help from a robust ticketing platform like Ticket Fairy, organizers can set precise ticket limits per session and monitor entry scans in real time, so they never invite more people than the beer stations can handle. Post-event data might also suggest tweaking session length – for instance, a 5-hour session where last hour consumption drops off could possibly be shortened to 4 hours to save costs and avoid the end-of-session scramble. In short, every metric from the event informs a tweak: the goal is an even better-balanced festival next time around.
Sharing Insights with Breweries to Prove ROI
Once the festival ends and the kegs are packed up, it’s time to turn data into value for your partners. Breweries invest time and resources to be at the event, and they’ll appreciate evidence that it paid off. A savvy festival organizer will share selective insights with the breweries that poured at the festival. This might include the number of pours each brewery served (e.g., “Brewery X served 500 samples of their Pale Ale and 300 of their Stout”), the times of day they saw the heaviest traffic, or even how their booth’s line measurements compared to the average. Such data helps breweries understand their performance and refine their festival strategy – maybe a brewery learns that their new hazy IPA was one of the top 10 most-poured beers of the day, indicating strong interest from attendees. It’s usually best to frame these insights in a positive, collaborative way. For example, you might tell a brewery, “You were among the most popular breweries in the early session,” or, “When you ran low on IPA at 3 PM, that actually sent 50 extra people to your nearest booth offering a similar style – there’s huge demand for your product!” This kind of information underscores the ROI for breweries by translating festival engagement into tangible metrics.
In fact, modern event tech can even provide sponsors and vendors with real-world data proving their ROI, offering innovative ways to amplify brand sponsorships. By delivering a post-event report highlighting attendee engagement, social media mentions, and volume of beer poured, organizers help breweries justify the cost and effort of participation. It strengthens the relationship for future festivals – brewers will be more eager to return when they can clearly see the benefits. Remember to be selective with what you share: provide enough data to be useful for the brewery’s marketing story, but avoid disclosing sensitive comparisons or any attendee personal data. The idea is to lift all boats with insight, not spark competition between brewers on who “won” the event. When done right, sharing analytics solidifies a partnership ethos – breweries see the festival not just as a fun day out, but as a business opportunity with measurable impact.
Conclusion
Operations analytics has become the secret sauce behind many of the world’s most successful beer festivals. From Mexico City to Munich, festival organizers who harness real-time data can transform an event from good to great. The ability to react in the moment – redirecting staff, changing out kegs, cooling down beer, or opening up new lines – separates a smooth, memorable festival from a chaotic one. Equally, the willingness to learn from data afterward means each festival builds on the last, continuously improving the mix of brews, the site layout, and the crowd flow. This analytical approach doesn’t replace the human touch and intuitive flair that festival producers bring – it enhances it. By combining on-ground experience with data-driven decision making, organizers create an environment where brewers, attendees, and staff all thrive. The next generation of festival producers can take these lessons to heart: listen to your event’s numbers as much as you listen to your guests. In doing so, you’ll craft festivals that are not only fun and engaging but also models of efficiency and impact. A well-run beer festival is a living thing, and with the right analytics, you can tune its heartbeat to perfection.
Frequently Asked Questions
Why is tracking pours per tap important at beer festivals?
Monitoring pours per tap reveals real-time consumption trends, identifying which beers are most popular and which are lagging. This data allows organizers to prepare backup kegs for fast-moving brews or redirect attendees to similar styles before a tap runs dry, ensuring popular options remain available and customers stay happy.
How can festival organizers reduce long beer lines using data?
Organizers use queue telemetry, ranging from staff reports to sensors, to identify where lines are building up in real time. With this intelligence, operations teams can immediately redeploy volunteers from quiet booths to busy areas or send roving beer runners to alleviate bottlenecks, keeping lines moving and preventing attendee frustration.
What methods maximize keg yield during a festival?
Maximizing keg yield involves consistent pour sizes and effective foam management to ensure more servings per keg and less waste. Simple tactics like using cups with marked pour lines or installing digital flow meters help staff control serving amounts. High yields are critical for profitability and keeping popular taps online longer.
How does post-event data improve future festival layouts?
Analyzing crowd movement and queue metrics helps identify congestion points and low-traffic “dead zones” within the venue. Organizers use these insights to space out popular breweries rather than clumping them together to balance foot traffic. Data on attendee preferences, such as flocking to shaded areas, also informs better booth placement.
Why should organizers share analytics with participating breweries?
Sharing selective insights, such as total pours served and peak engagement times, demonstrates the return on investment (ROI) for breweries. Providing concrete performance metrics helps partners refine their strategies for future events and strengthens the business relationship, making them more likely to return and invest resources in the festival.
When should festival staff be redeployed during an event?
Staff should be redeployed the moment real-time data indicates a surge in demand at specific locations. If analytics show rapid keg depletion or long queues at a particular tent, crew members from quieter sections are shifted to these hot zones to pour beer or replenish ice, preventing service slowdowns before they escalate.
How do real-time analytics improve overall beverage festival logistics?
Real-time analytics streamline beverage festival logistics by providing instant visibility into inventory depletion, queue lengths, and staff efficiency across the entire venue. Instead of relying on manual checks, organizers can use this data to proactively route ice, specialized glassware, and backup inventory to vendors before they run out, ensuring a seamless operational flow even during unexpected crowd surges.