The Rise of Real-Time Event Analytics
Real-time event analytics has emerged as a game-changer for live events. Gone are the days when organizers had to rely on end-of-day reports or gut instincts during a festival or conference. In 2026, real-time event analytics tools deliver immediate insights that allow teams to act while an event is underway, not just afterwards. Experienced event producers recall how, in the past, issues like long queues or overcrowded rooms were often only recognized after complaints rolled in. Now, live dashboards and instant data feeds let organizers see problems developing in the moment and respond within minutes, as immediate data-driven decisions improve session engagement and outcomes. The result is a proactive approach to event management that improves safety, boosts revenue, and elevates the attendee experience.
This shift toward live event analytics has been driven by several factors. First, technology infrastructure at venues has caught up – high-speed networks (including widespread 5G and robust Wi-Fi) and IoT sensors make it possible to monitor everything from ticket scans to crowd density in real time. Second, modern event technology platforms with analytics are increasingly API-driven and integrated. Instead of data silos, ticketing, access control, mobile apps, and point-of-sale systems can all feed into one unified dashboard. This open architecture means organizers get a single source of truth during the show, which is essential when setting up a tech command center. Finally, the expectations of stakeholders have evolved. Attendees expect seamless experiences, and sponsors demand proof of engagement and ROI. Instant data makes it feasible to meet these expectations by enabling on-the-fly adjustments. As one festival director described, their team moved from reactive “fire-fighting” to proactive management once they embraced live analytics and moved their approach from reactive to proactive. In short, real-time data has gone from a nice-to-have to a must-have for events aiming to run as smoothly as a Formula 1 pit stop.
To appreciate why real-time event analytics is transformative, consider the stakes: A delay in reallocating staff when entry lines swell can mean hundreds of frustrated guests. Missing a spike in crowd density around a stage could lead to unsafe conditions if not rapidly addressed. Conversely, catching these trends in time allows organizers to avert issues and even create positive surprises – like opening an impromptu overflow viewing area for a packed session. Live data turns what used to be post-mortem analysis into immediate action plans. According to industry analysis, events that leverage real-time monitoring have significantly improved outcomes, such as cutting average wait times by 30–50% and increasing attendee spend per head, a tangible benefit of moving to RFID systems. It’s no wonder the adoption of these tools is surging. The global market for RFID and related event tech (a backbone of real-time tracking) is projected to grow from $17.1 billion in 2025 to nearly $37.7 billion by 2032, highlighting how the event technology industry continues to expand rapidly – a clear indicator that live data capabilities are becoming core to event operations.
Key Real-Time Metrics Driving On-Site Decisions
Real-time analytics can encompass a wide array of data points. The key is focusing on metrics that empower staff to make on-the-fly decisions with tangible impact. Here are some of the most critical live metrics and how they inform event management:
Go Cashless With RFID Technology
Enable contactless payments, faster entry, and real-time spending analytics with RFID wristbands and NFC-enabled ticketing for your events.
Live Attendance and Entry Flow
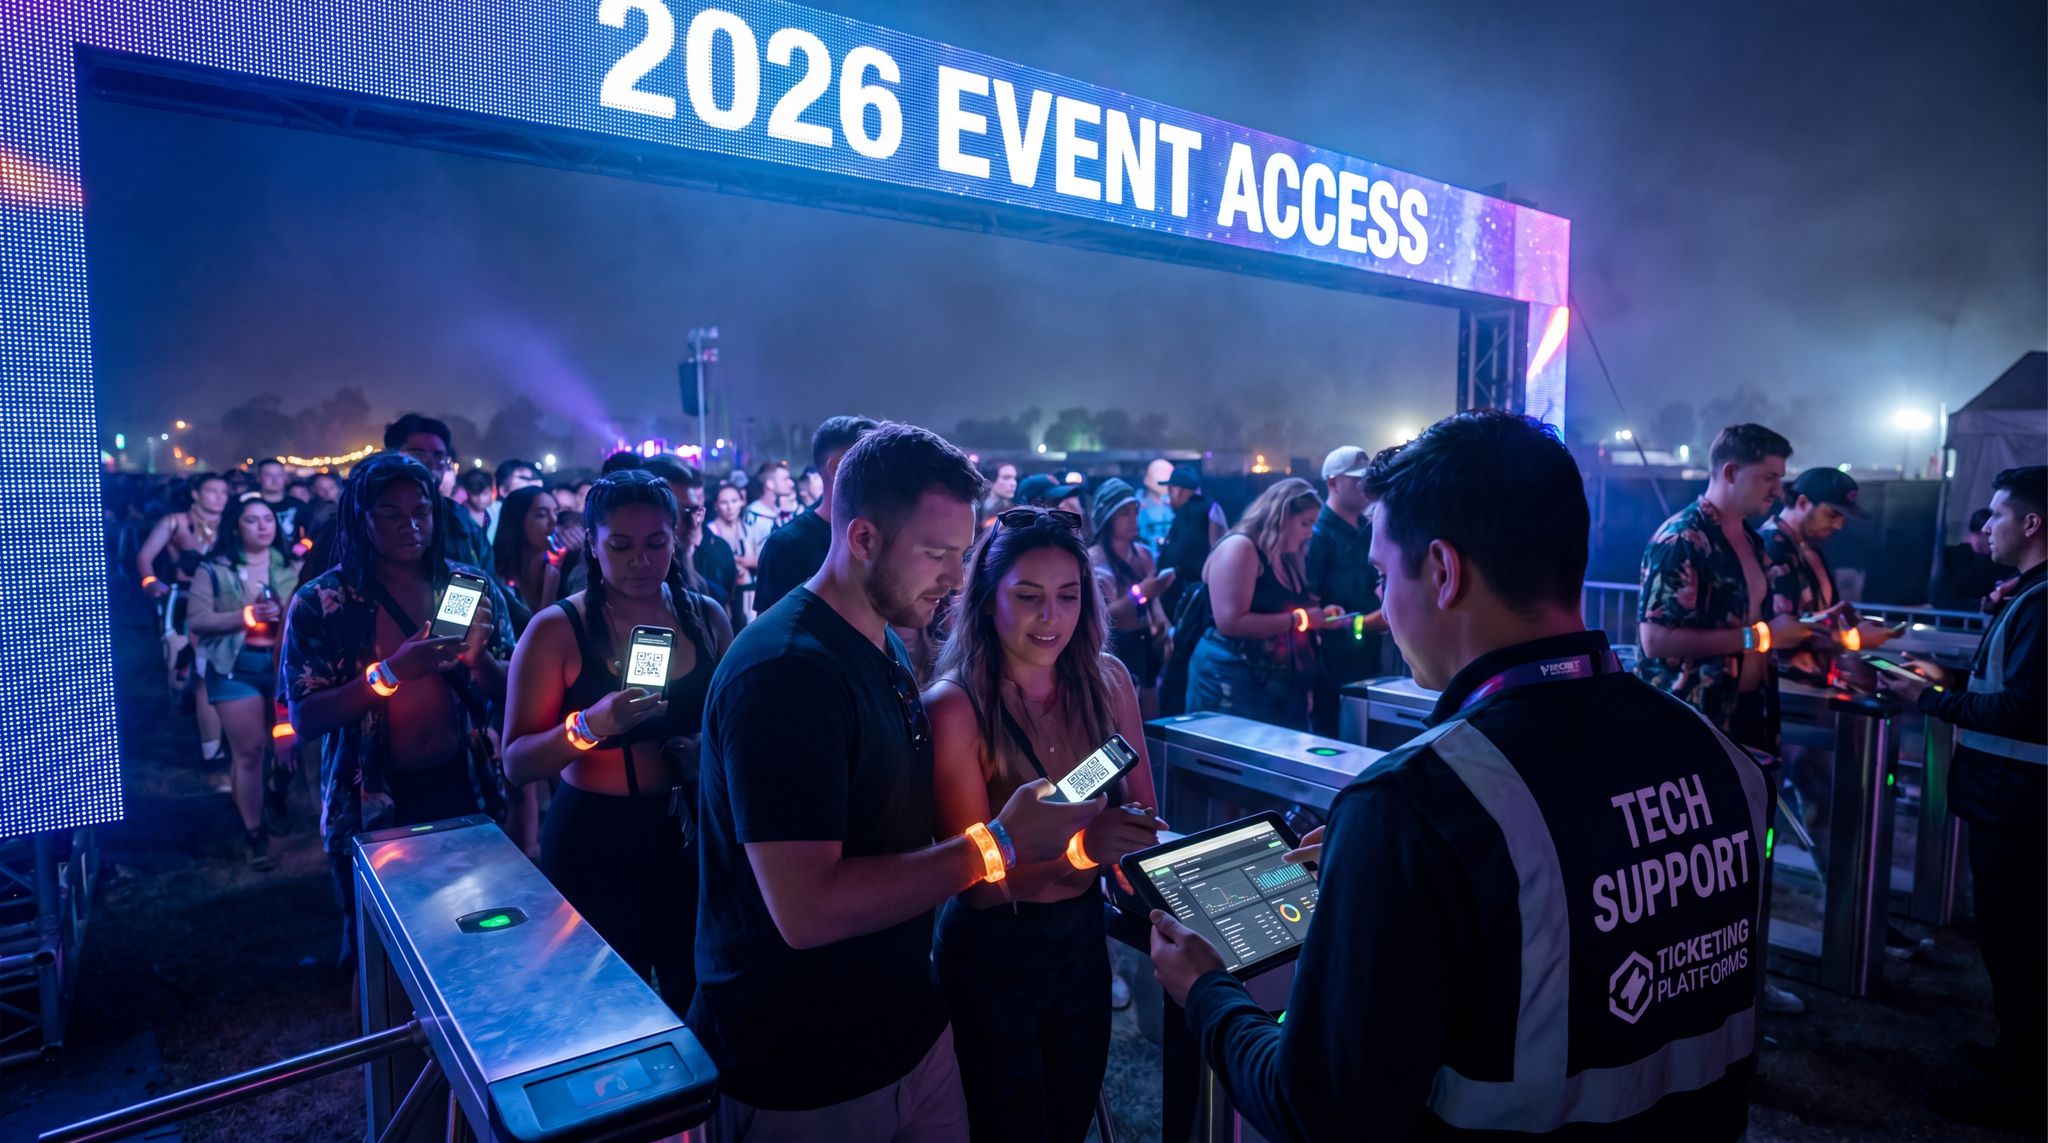
One of the first places events harness real-time data is at the entry gates. Monitoring ticket scans as they happen gives a real-time event data dashboard view of how many attendees are on-site, how quickly lines are moving, and where bottlenecks might be forming. For example, if the dashboard shows 500 people entering through Gate A every 10 minutes while Gate B lags at 100, management can immediately reallocate staff when lines grow at Gate A or open an additional screening lane. In practice, venue operations teams have cut queue times dramatically by using these live counts – some festivals report entry wait times dropping by 40% after implementing real-time RFID wristband scanning, meaning thousands more attendees get in faster and have more time to spend inside, unlocking personalized experiences and boosting on-site sales. The ability to see up-to-the-second entry numbers also helps with safety: organizers can halt entrance temporarily once a venue approaches capacity, avoiding dangerous overcrowding.
Modern access control technology makes this possible even at massive scale. At a 50,000-person festival, for instance, an integrated ticket scanning system will sync data from dozens of turnstiles or handheld scanners to a central platform. Solutions like a mobile ticket scanning app with offline sync ensure that even if connectivity blips, scans are captured and updated as soon as the network is available – preserving an accurate live headcount. For smaller events or conferences, the same principle applies: a check-in desk with badge scanners or QR code readers feeds an attendee list that updates in real time. Organizers of a 1,000-person convention can watch the check-in rate and decide to delay the opening keynote by 10 minutes if many people are still in line at the door. Live event analytics dashboards often highlight entry trends (e.g. 85% of expected attendees have arrived by 10 AM) so that programming can be adjusted accordingly. The goal is that no one misses the start of the show due to preventable queue issues.
Ready to Sell Tickets?
Create professional event pages with built-in payment processing, marketing tools, and real-time analytics.
On-Site Sales and Concession Data
Another rich vein of real-time insight comes from on-site sales data. At festivals, concerts, and sports games, millions of dollars can change hands at food stalls, merchandise booths, and bars. Tracking those transactions in real time allows organizers to make revenue-driven decisions on the spot. For instance, if live reports show that drink sales at the main bar are far outpacing those at other locations, managers could dispatch a few extra bartenders or open a “pop-up” bar in a busy area to capitalize on demand. Or consider a scenario where merchandise sales data indicates the inventory of a popular T-shirt is running low by mid-day – the team might prioritize a quick restock from the warehouse during a quiet period, rather than discovering the shortfall after dozens of would-be buyers left empty-handed. Real-time visibility into sales and inventory helps maximize revenue and smooth the attendee experience (no one likes finding out the item they wanted is sold out).
These capabilities usually rely on a connected point-of-sale (POS) or cashless payment system. Many festivals now use RFID wristbands or mobile payments, which automatically log each purchase into a central system the moment it’s made. This means the finance team and operations team see the same live feed of how much each vendor has sold and even current stock levels if integrated with inventory management. With an RFID cashless payment platform, organizers not only reduce queues (cashless transactions are faster) but also gain a real-time window into spending patterns. For example, one festival’s live sales dashboard might reveal that Food Truck “A” has served 500 customers in the last hour (and is getting slammed), while Food Truck “B” only saw 100. In response, they could push a notification through the event app promoting Food Truck B’s offerings to spread out the crowd, or temporarily adjust staffing by moving a runner or chef over to A. At multi-day events, these sales trends can even influence the next day’s operations – e.g. increasing stock of a top-selling beverage for Day 2 if Day 1 data shows it nearly sold out. Stakeholders love this kind of agility: sponsors and vendors feel taken care of when the organizer can actively help optimize their success via data. And internally, it means more efficient operations and potentially higher overall spend per attendee, since fewer sales are lost to long lines or empty shelves.
Crowd Density and Movement Patterns
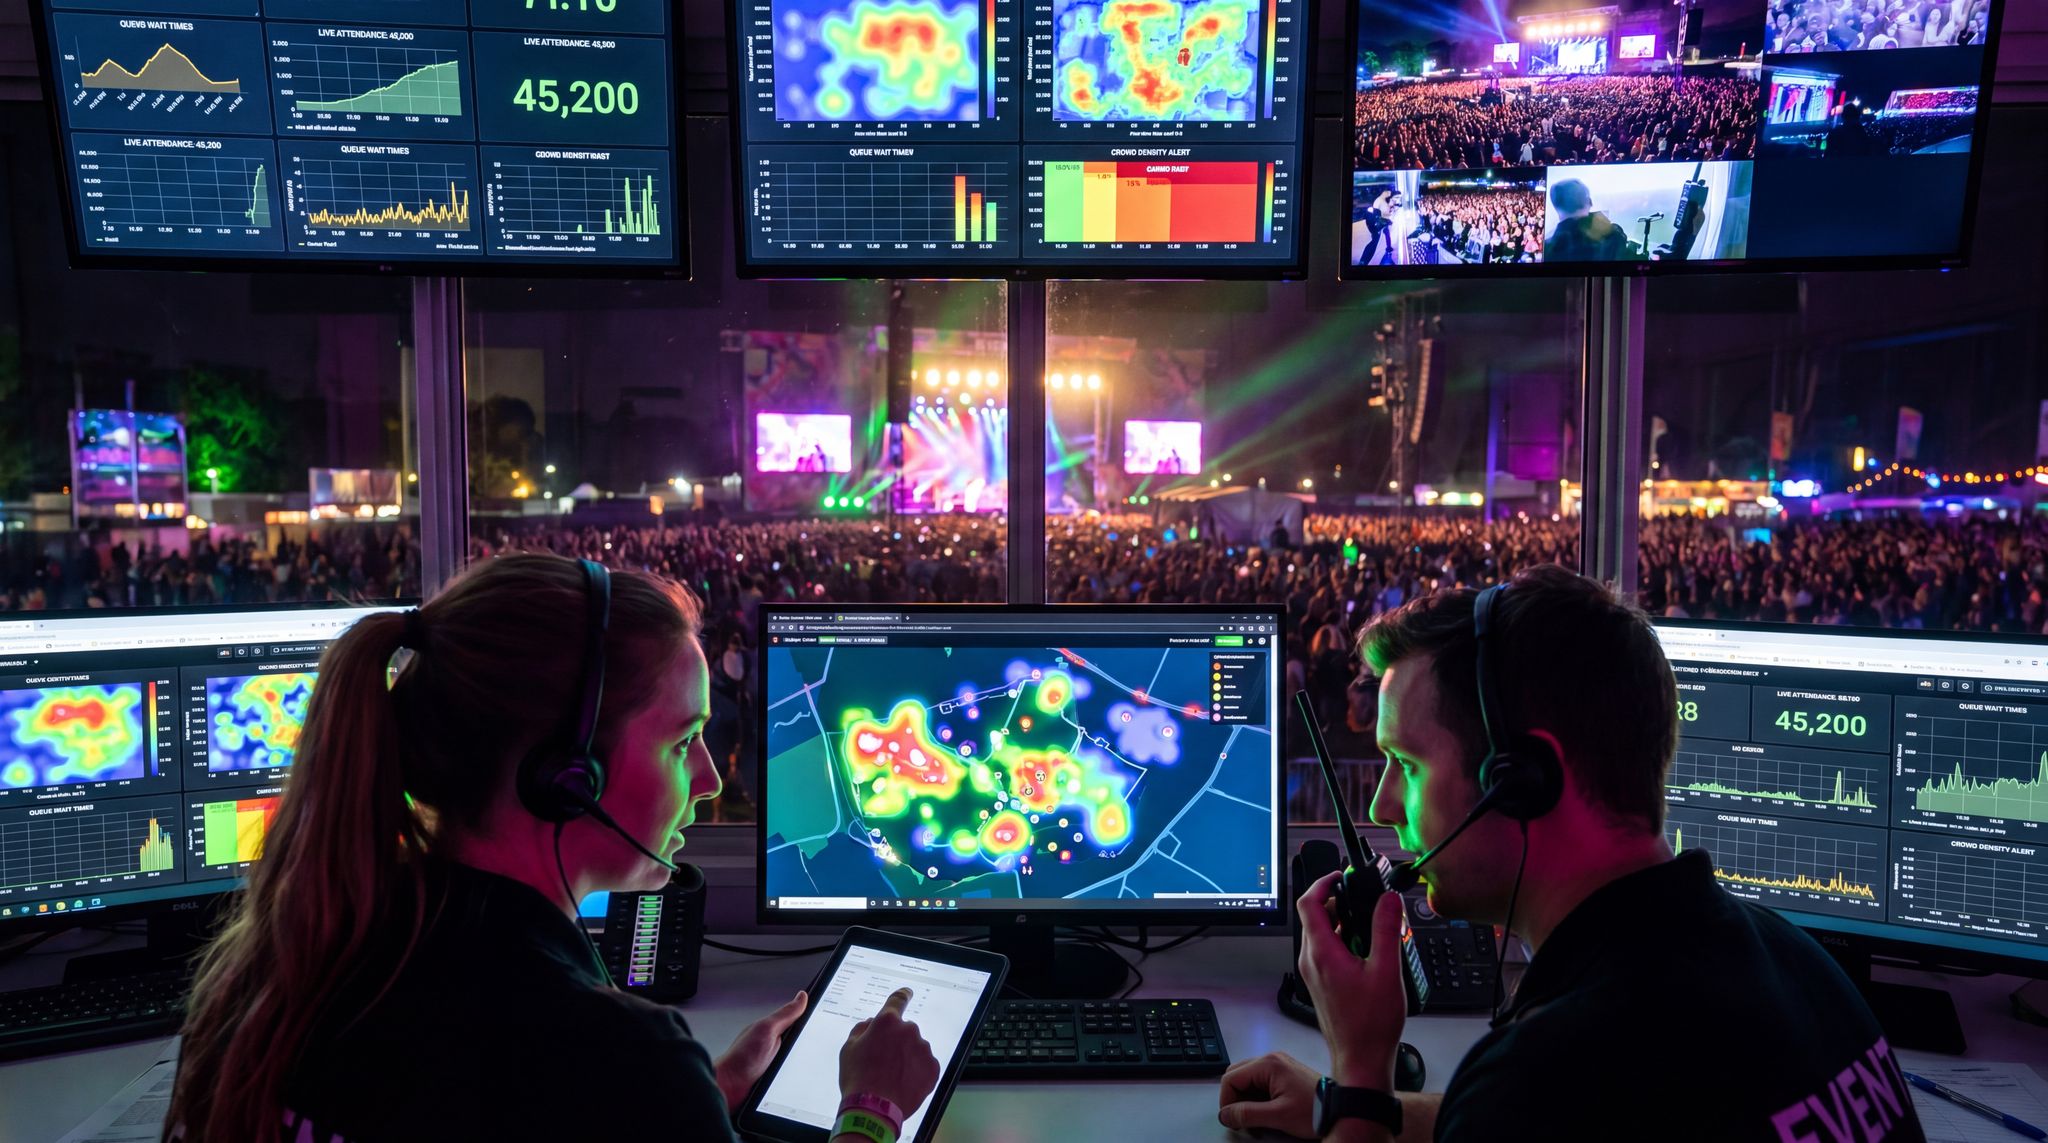
Perhaps the most lifesaving use of real-time analytics is in crowd management. Understanding how attendees are distributed across a venue in real time lets organizers prevent dangerous overcrowding and balance the fun. Technologies like RFID and IoT sensors have made live crowd flow monitoring a reality at scale. Every time an attendee’s wristband is scanned at a gate or checkpoint, that data point updates the live count of people in that zone, since every RFID interaction provides a valuable data point. By aggregating thousands of these data points, large events can display a dynamic heat map of crowd density: which areas are packed, which are sparse, and how flows are changing over time to give organizers a comprehensive view of the show. For example, a multi-stage music festival might have RFID portals at each stage entrance. At any given moment, command center screens can show that Stage X has 8,000 people while Stage Y has 2,000, revealing exactly how attendees distribute themselves across the venue. If Stage X is nearing its safe capacity, organizers can make data-driven adjustments on the fly by utilizing built-in real-time monitoring tools – perhaps by sending a message in the app or on the video screens saying “Plenty of space at Stage Y for those looking for dancing room!” or dispatching staff to guide some of the crowd toward other attractions, allowing the control room to steer excess crowd flow away from dangerous bottlenecks. This proactive crowd redistribution not only averts safety hazards but often improves attendee enjoyment (nobody likes being squished in an over-full arena when there’s a comfy spot elsewhere).
Real-time crowd analytics were once the domain of only the biggest events with huge budgets, but 2026 has seen them become attainable even for modest-sized festivals and venues, proving that this kind of data monitoring is highly accessible. The key is integration between systems and using the data you likely already collect. If you have digital ticket scanning and a floorplan, you’re partway there. Many venues now use overhead sensors or camera-based systems to count people in an area without requiring wearables – for example, some stadiums employ AI cameras to monitor queue lengths at concession stands and automatically update a “wait time” display for fans. Even Wi-Fi or Bluetooth signals can be leveraged: if 5,000 phones are connected in Zone A and only 500 in Zone B, that ratio gives a rough sense of crowd distribution. Event technology platform analytics often combine multiple inputs (scans, device counts, camera feeds) to present operators with a unified crowd dashboard. Mission control centers at major events typically have a map with live density colouring on the wall, a setup that a modern mission control center requires for large-scale events. If anything turns bright red (too crowded) or starts trending sharply upward in numbers, alerts can be triggered. For instance, an alert might pop up if any zone exceeds 90% of its capacity, prompting immediate action from the safety officer. These measures have real-world importance: investigations into past crowd tragedies (like the Astroworld 2021 incident) highlight that a lack of unified real-time crowd monitoring can contribute to disaster, whereas central command centers with shared live data allow issues to be caught in time, ensuring that nothing slips through the cracks and experienced producers can keep events running smoothly. In short, real-time crowd analytics aren’t just about efficiency – they’re about duty of care.
Attendee Engagement and Behavior Signals
Not every useful real-time metric is about physical movement or sales. Digital engagement metrics also provide valuable clues that organizers can act on during an event. For example, if you have a mobile event app or a live polling system, monitoring its usage can tell you what attendees are interested in (or not). Are people actually using the networking feature in your conference app? Which session’s live Q&A has the most questions coming in? If you see that a workshop at a convention has double the number of poll responses compared to other sessions, it’s a sign that interest is high – perhaps you could extend the Q&A portion or arrange an encore session on the fly. Conversely, if a certain interactive kiosk or activation is getting very little engagement, the team might decide to give it a shout-out on social media or venue announcements to drive more traffic there before the day ends.
Social media and online chatter are another form of real-time feedback. Dedicated event monitoring teams often keep an eye on Twitter, Instagram, and Facebook mentions during live events. A spike in tweets about “long lines at beer tent” or “Can’t hear speaker in Room B” is effectively a real-time alarm that something’s amiss, even if it’s anecdotal data. Savvy organizers treat these signals like an advance warning system – if multiple attendees post about low audio at a stage, the A/V crew can be dispatched to adjust the sound before official complaints pile up. Modern analytics tools can aggregate these sentiments by scanning hashtags or geotagged posts in real time, adding another layer to the live dashboard. While qualitative, this information is directly tied to attendee experience and can guide immediate improvements (for instance, opening another entry when “#entryline” starts trending locally). Some events even implement live sentiment analysis tools that visualize crowd mood based on social feeds, giving a quick read on attendee satisfaction throughout the day.
Finally, consider real-time engagement data for sponsors and vendors. If you promised a sponsor that you’d deliver attendee interactions at their booth, you can track scans or app check-ins at that booth hour by hour. If by mid-event the numbers are low, you still have time to intervene – maybe by having the MC mention the sponsor’s booth on stage (“visit Booth 12 by 3pm for a special giveaway”) or by sending a push notification with a discount code for that sponsor’s product. This kind of mid-course correction can salvage value for partners while the event is still happening, rather than apologizing after the fact. It demonstrates to sponsors that you’re on top of things and committed to delivering ROI. In one real-world example, a large expo noticed through live data that a VIP demo zone was under-attended on Day 1 – they realized the zone’s location was tucked away, so overnight they improved signage and ran an in-app alert. Day 2 saw significantly higher footfall in that area, ultimately satisfying the exhibitors in that zone. The lesson is that engagement data should not be shelved until the post-event report; in 2026 it’s a real-time tool to enhance experiences for attendees and stakeholders alike.
Making On-the-Fly Decisions: Real Examples in Action
Having data is one thing; using it intelligently under pressure is another. Let’s explore how different types of events are leveraging live analytics to drive better outcomes in real time. These examples illustrate the spectrum from large festivals to intimate conferences and venues, showing that the principles of data-driven decisions apply at any scale.
Festivals: Command Centers and Crowd Control
Major music festivals and outdoor events have become pioneers of real-time analytics, often operating sophisticated “mission control” centers. Take a hypothetical mega-festival with 100,000 attendees (think along the lines of Glastonbury or Tomorrowland). Behind the scenes, you’d find a room filled with screens where a cross-functional team – security, operations, production, medical, and tech – monitors incoming data. They see entry scan counts ticking upward by the second, live CCTV feeds of stages and exits, heat maps of crowd density updated via RFID scans, and even real-time weather radar, which is standard practice for setting up a tech command center. This unified view enables split-second decision-making. For example, when one headliner’s stage started approaching unsafe crowd density, producers at a real festival were able to redirect thousands of attendees in real time by relaying messages on video screens and in the mobile app, suggesting fans check out a less crowded stage where another act was starting, allowing them to proactively redirect crowd flow and steer attendees away from bottlenecks. That proactive redirection likely prevented hundreds of would-be fans from pushing into an already packed area, avoiding a potential safety issue while also giving the other stage a boost in audience – a win-win outcome.
Festivals also use real-time analytics for more routine (but crucial) adjustments. At many events, live data on entry rates and traffic is used to dynamically allocate staff. Early each day, there might be a surge of arrivals at the main gate; the command center sees this on the dashboard and immediately radios for additional ticket scanners and security personnel to move to that gate for the first two hours based on live data insights from access control systems. Later in the evening, as re-entry slows, those staff can be redeployed to other tasks like crowd patrol or assisting at exit lanes. The same festival might monitor cashless payment data to catch any technical issues – e.g. if one POS system goes offline in the beer tent, an alert can prompt the tech team to fix it before a long queue forms. There have been cases where real-time transaction monitoring spotted that a network issue was preventing credit card transactions in one zone; with mission control watching, they rebooted the system within minutes and informed the vendor, averting major revenue loss. In the past, that vendor might have struggled for an hour, losing sales, before the problem was escalated. Live dashboards now act as an early warning system for any such glitches in the field, helping teams rehearse scenarios so everyone knows how to respond. As a result, attendees see fewer interruptions – the beer keeps flowing and the music never stops due to “mystery” tech troubles.
Data-Driven Event Marketing
Track ticket sales, demographics, marketing ROI, and social reach in real time. Exportable reports give you the insights to make smarter decisions.
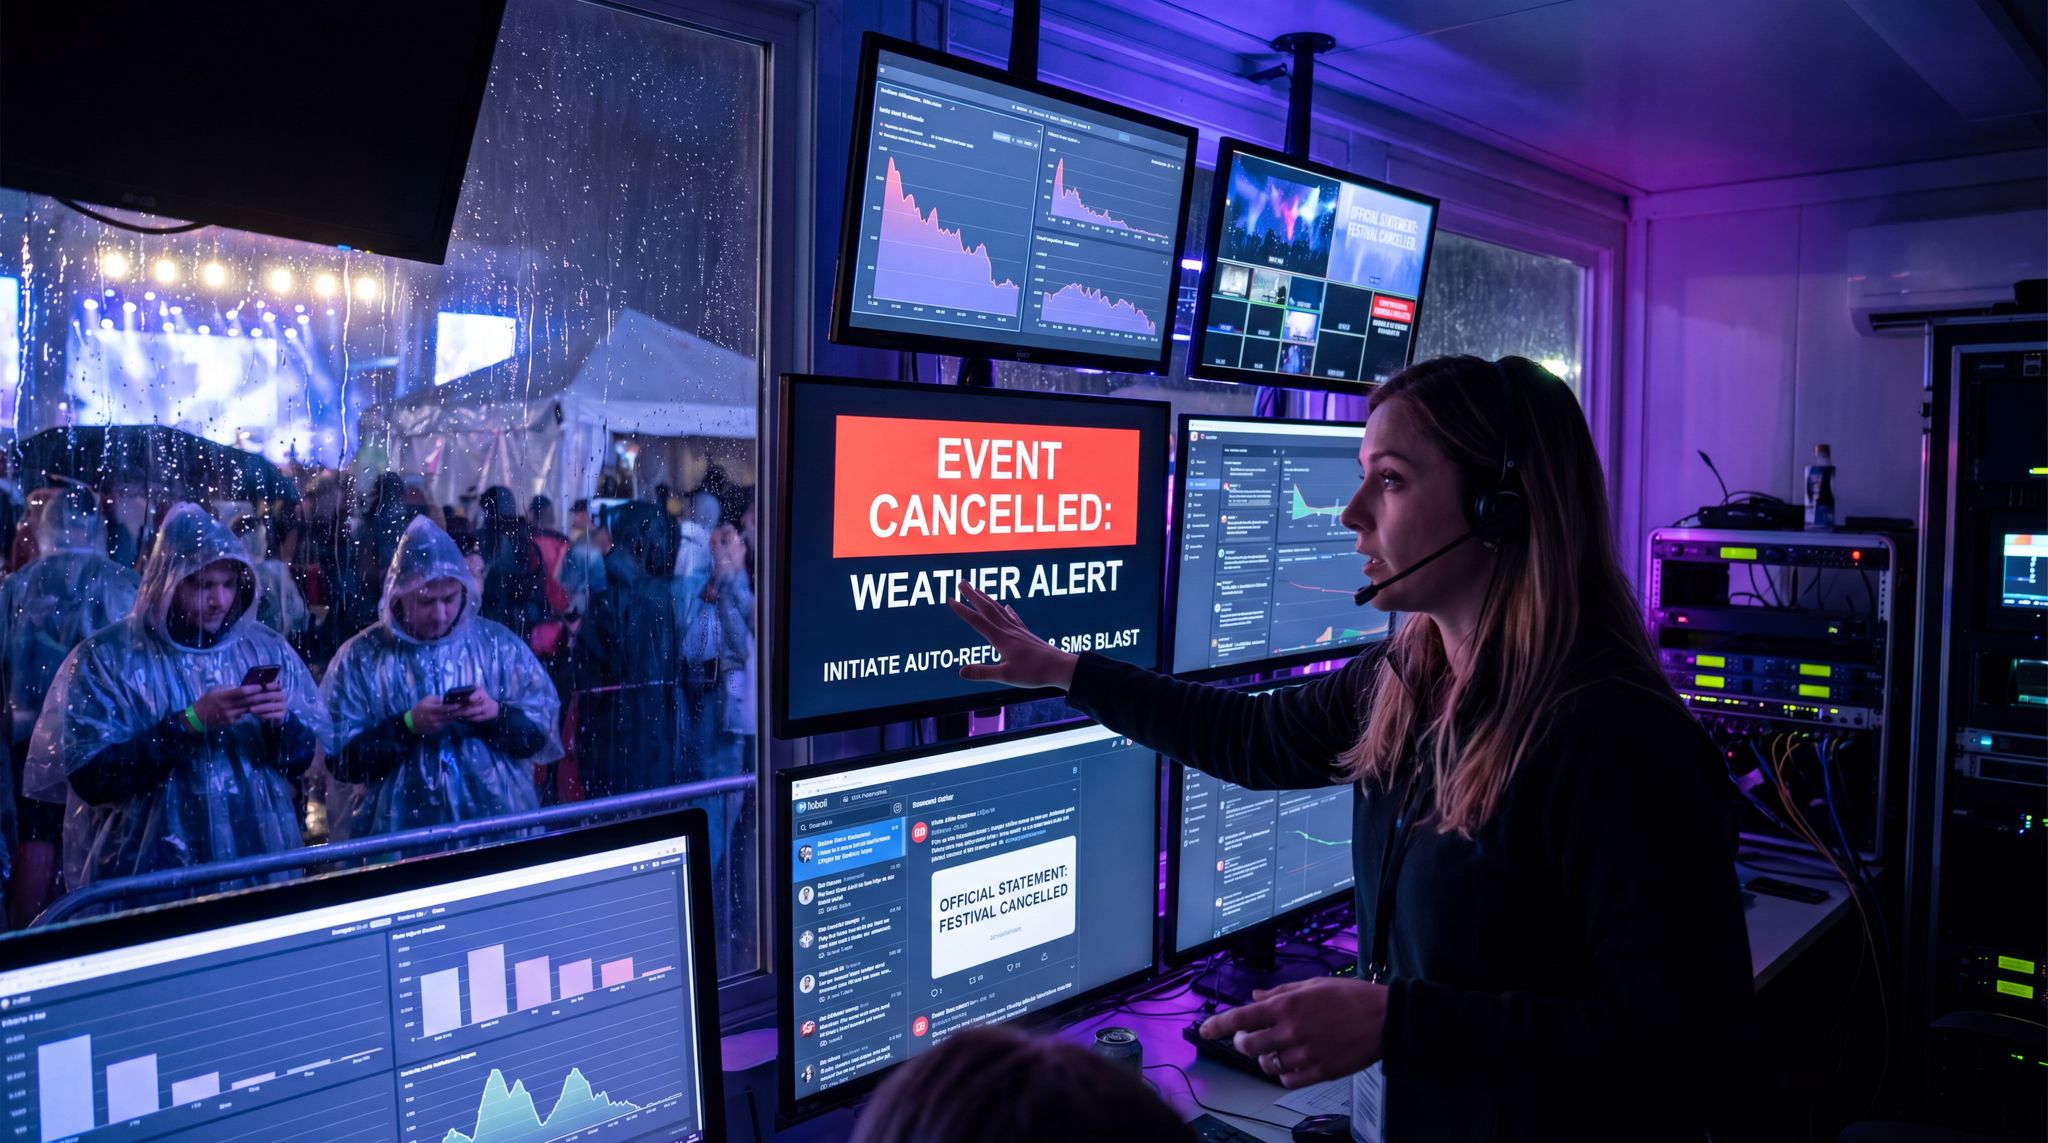
From a safety perspective, festivals are increasingly acting on real-time intelligence. If multiple sensor inputs or reports indicate a developing issue (say, an overcrowded exit or a sudden weather change), the command center coordinates a rapid, multi-team response. A prime example is lightning at outdoor festivals: with weather monitoring on-screen, organizers can make the call to pause the show and evacuate before the storm hits, rather than reacting after chaos ensues. Real-time headcount tracking also means that if evacuation is necessary, the team can confirm when each zone is clear by seeing the number of wristbands still detected in that zone drop to zero, significantly enhancing safety with real-time tracking and alerts. This was historically done by visual sweeps; now it’s augmented by tech. These capabilities highlight why mission control centers are now standard practice for top-tier festivals, as monitoring every critical system in real time is what experienced producers note keeps events running smoothly. Even events that aren’t at 100k attendance are setting up scaled-down versions – perhaps just a few laptops running a unified festival tech stack dashboard – because having all your data in one place enables a level of responsiveness that just wasn’t possible a decade ago.
Conferences: Enhancing the Attendee Experience Live
Professional conferences and trade shows might seem more controlled than free-flowing festivals, but they too benefit enormously from real-time analytics. One common use case is managing session capacity. Organizers often schedule popular talks in bigger rooms, but sometimes interest exceeds expectations. With live attendance tracking (through badge scans at the door or a conference app’s check-in feature), conference staff can immediately see if a breakout session is filling up too fast. For instance, imagine a tech conference where a breakout session on AI starts to overflow – attendees are lined up outside and the room is at 100% capacity five minutes before start. If the organizers have a live event data dashboard for session attendance, they might catch this trend early enough to react. Solutions could include quickly opening a divider wall to an adjacent room to increase capacity, or setting up a video stream to a nearby lounge for overflow viewing. In fact, some conferences pre-plan an “overflow space” precisely for this scenario, but only activate it if the real-time data shows it’s needed. The difference is huge: instead of turning away 100+ eager participants (and likely angering them), you accommodate them and turn it into a positive. This agility is only possible if you’re actively monitoring the numbers as people enter. One academic conference in 2025 did exactly this – when entry scans showed a keynote was 95% full with attendees still arriving, they transmitted the video and slides to an adjacent room within 10 minutes. Attendees later praised the organizers for thinking on their feet, which turned a potential fiasco into a value-add. This proves that when data is available instantly, live decisions happen fast and with confidence.
Grow Your Events
Leverage referral marketing, social sharing incentives, and audience insights to sell more tickets.
Trade shows use real-time analytics in other clever ways. Consider exhibitor support: event organizers can see which booths are getting heavy traffic (via dwell time sensors or RFID-enabled lead capture devices) and which are more idle. If a high-paying exhibitor’s booth is strangely quiet, the organizer’s sales team might step in during the show to assist – perhaps by introducing a roaming mascot to draw attention to that booth or adjusting the floor plan’s wayfinding signs. On the flip side, if one booth is constantly mobbed (a good problem, but still a problem if it causes aisle congestion), real-time data can trigger additional crowd control or even a friendly suggestion to that exhibitor to split their demo into two stations. Some expos share a “live leads” report with their exhibitors at midday, highlighting which hours saw the most scans. Exhibitors love this because it helps them strategize their staffing (e.g. “Tomorrow between 11am and 1pm looks busy based on today’s data, so let’s have all five reps at the booth then”). It also allows organizers to deliver on promises of attendee engagement. Instead of just saying “we had 5,000 people on the show floor today,” they can say “Booth #212, you saw 300 unique visitors in the first half of the day, here’s how that compares to others, and here’s what we’re doing to drive more your way in the afternoon.” This level of service was unheard of when data only came after the event; with live analytics, the show becomes a collaborative, data-informed effort between organizers and participants.
Another area where conferences apply real-time data is attendee feedback and sentiment. Many events solicit feedback in real time through apps (“Rate this session” prompts, live polls on what attendees want more of, etc.). By mid-event, organizers can gauge satisfaction levels and pivot if needed. For example, if feedback shows attendees are universally complaining about Wi-Fi quality by lunchtime on Day 1, the IT team can be mobilized to add bandwidth or troubleshoot network issues for Day 2, rather than shrugging it off until post-event surveys. Even food and beverage adjustments can be prompted by real-time sentiment: if social media is full of complaints about long coffee lines at a convention center, organizers can arrange additional coffee stations for the next break. The ability to adapt instantly based on attendee behavior and feedback is what turns a good event into a great one, a strategy that experienced event producers use to keep events running smoothly. Attendees feel heard when their issue is addressed almost immediately – it’s the event equivalent of a restaurant comping a dish that diners didn’t like, except here you’re fixing the experience on the fly so they continue to enjoy the event. In summary, conferences that use real-time analytics can deliver a more personalized, responsive experience, which is crucial for winning repeat attendees in a competitive events market.
Arenas and Venues: Smoother Operations Night After Night
Large venues like stadiums, arenas, and theme parks have also embraced real-time data to optimize operations – often with very visible effects for patrons. A prime example is how venues handle concessions and amenities. Many pro sports stadiums now deploy systems that monitor queue lengths at food stands and restrooms in real time. Overhead cameras or wireless sensors detect how many people are waiting, and that data is fed into both operational dashboards and sometimes directly into fan-facing apps using specialized venue queue management solutions. If one concession lane is consistently long, managers can react by opening another register, or even sending a mobile hawker into the stands with popular items. Simultaneously, fans looking at the venue app might see that “Line at Pizza Stand A ~ 5 minutes, Pizza Stand B ~ 2 minutes” and adjust their own behavior – distributing foot traffic more evenly. The result is higher satisfaction (shorter waits for food or bathrooms) and likely higher sales (fans are more willing to grab that extra beer if the line isn’t daunting). In fact, data from a 2025 pilot showed that introducing AI-based line monitoring and express self-checkout at college football stadiums cut average wait times by up to 80%, significantly increasing throughput and revenue, as recent analysis shows self-checkout cuts gameday wait times drastically. Those are hard numbers that any venue operator can appreciate.
Real-time analytics also help venues manage ingress and egress for concerts and games. Similar to festivals, many arenas track how quickly people are scanning in at each gate. Ever notice how some stadiums will suddenly open additional doors or have staff with scanners appear to form a new line? That’s often driven by a back-of-house view that shows Gate 1 getting backed up while Gate 3 is free-flowing. By redistributing entry points or making on-the-spot announcements like “Fans with only mobile tickets, please proceed to Gate 3 for faster entry,” operations teams can balance the load across entrances. This kind of dynamic entry management is especially valuable when dealing with late-arriving crowds (e.g. everyone shows up 10 minutes before kickoff). On the flip side, when the game or concert ends, live crowd flow data can inform how security directs the exit. If one parking lot or train station is over capacity, they might temporarily hold some people inside (perhaps keeping the concession open a bit longer to stagger departures) or guide crowds to alternate exits to avoid jams outside. Venue operators often coordinate with city transit in real time as well – for example, sending a trigger to municipal transit to deploy more trains or buses when sensors indicate a surge of 20,000 people heading for the exits.
Smooth Entry With Mobile Check-In
Scan tickets and manage entry with our mobile check-in app. Supports photo ID verification, real-time capacity tracking, and multi-gate coordination.
Even A/V adjustments can be influenced by real-time data at venues. Modern arena shows use interactive apps and RFID-enabled VIP sections, which can provide feedback on which parts of the show are engaging the crowd. If data showed, say, that a new AR-powered fan engagement during halftime wasn’t getting a lot of participation (maybe only 1000 app opens when 10,000 were expected), the production team might simplify the instructions on the big screen or have the host give it another push in the second half. On a more technical level, some venues monitor sound levels and crowd noise in real time across sections – if one section is notably quieter (perhaps because an A/V delay or speaker issue), they can adjust the sound mix or have an engineer fix a speaker cluster on the fly. The goal is consistent, high-quality experience for everyone in the building, and data helps pinpoint where reality deviates from that goal.
All these examples share a common theme: instant data feedback loops lead to immediate action. Whether it’s a festival dispatching crews to relieve a crowd bottleneck, a conference tweaking its schedule midday, or a stadium shaving 10 minutes off wait times, the capacity to see and react to live information is transforming event operations. Crucially, the technology is not working in isolation – it’s empowering human decision-makers. The analytics might flag an issue or opportunity, but it’s the experienced event manager who decides how to address it in the context of the event’s unique personality and goals. That partnership between data and human expertise is at the heart of why real-time analytics are so powerful.
Building the Real-Time Analytics Tech Stack
Implementing true real-time reporting at events requires the right combination of technology and planning. It’s not as simple as flipping a switch; organizers need to ensure data is being collected, transmitted, and presented in a useful way with minimal delay. Here are the core components and considerations for enabling instant insights at your event:
-
Connected Data Sources: Start by identifying all the systems that generate data during your event. Common sources include ticketing/check-in systems, RFID access control, cashless payment or POS systems, mobile event apps, social media feeds, and cameras or sensors. These systems must be capable of outputting data in real time (or near-real-time). An API-first ticketing platform or open systems with webhook support are ideal – they can push every scan or sale as it happens into your central database, which is why many organizers have moved toward open APIs for seamless integration. If any critical system is a closed silo (for example, a vendor’s scanning system that only provides data at end-of-day), consider upgrading or integrating through middleware. As a rule, favor platforms that offer live data access and integrations. Many organizers are now choosing open API-driven ticketing systems over monolithic legacy tools specifically to enable seamless real-time data flow between systems.
Seamless RFID Data Integration — Every scan provides an immediate data point that helps maintain an accurate live headcount for safety and operations. -
Unified Dashboard: Aggregating all that data into a single, user-friendly view is essential. During a live event, your team doesn’t have time to log into five different systems and cross-reference numbers. They need a unified event operating dashboard that pulls in key metrics and updates them automatically. This can be achieved via an all-in-one platform or custom integration of multiple tools. Some organizers use business intelligence software to create a custom dashboard; others leverage an all-in-one event operating system that has these dashboards built-in for entry counts, sales, demographics, etc. The dashboard should be configurable – each event might have different KPIs. For instance, a festival dashboard might prioritize crowd density and drink sales, while a B2B conference might put session attendance and lead scans front and center. The interface should use visual cues (graphs, heat maps, alerts) to make anomalies obvious. If entry wait times spike beyond a threshold or a zone hits capacity, the system could flash a warning or send a notification to staff phones. A real-time event analytics platform that provides such a “single source of truth” ensures everyone from the production manager to the security chief is looking at the same facts on the ground, ensuring you establish a single source of truth and don’t let data live in silos.
-
Robust Network Infrastructure: All the fancy analytics in the world won’t help if your data can’t travel from point A to point B reliably. Real-time requires connectivity. For on-site systems like scanners and IoT sensors, that usually means a strong local network (Wi-Fi, Ethernet, mesh, or cellular). It’s critical to plan bandwidth for peak load – e.g. thousands of devices might be scanning or sending data concurrently at festival gates opening time. Network redundancy is equally important. Seasoned implementation specialists recommend multiple internet uplinks for the command center or cloud dashboards, because a command center is only as good as its network reliability. A common setup is a primary wired connection (fiber or cable) and a backup 4G/5G router, plus offline caching at the edge devices. This way, even if one connection drops, data continues to flow or at least queues for a short time. Many ticket scanners and payment systems offer offline modes that sync data as soon as connectivity returns, which is a lifesaver – just ensure the offline duration is minimal for “real-time” needs. At big events, IT teams often set up a dedicated VLAN or separate network exclusively for operational data, to avoid competition with public guest Wi-Fi so critical systems don’t accidentally get cut off by network congestion. Power backup plays a role too; a power outage shouldn’t take down your command center screens or network gear. UPS units and generators keep the real-time nerve center alive through glitches, since power backup is equally vital during showtime operations. In one case, a festival’s command center lost main power due to a tripped breaker, but their systems stayed up thanks to UPS backup – they continued monitoring and coordinating evacuation during a storm without a hitch. The bottom line is resilience: plan for network and power failures so your live data doesn’t go dark when you need it most.
Hardening Your Data Infrastructure — Redundant network and power systems ensure your analytics stay online even during unexpected technical glitches. -
Data Processing and Latency: “Real-time” doesn’t always mean literally instantaneous, but the goal is to reduce latency to a point where it’s operationally useful. Human reaction time and decision-making can typically work with data that’s a few seconds old, but not much more in critical situations. Ensure that your data pipeline (scanners -> network -> database -> dashboard) is optimized to refresh quickly. Using cloud-based dashboards can be powerful, but consider local caching or on-premise solutions for ultra-low latency needs like crowd safety. Advanced setups might involve edge computing devices on-site that aggregate and analyze data right at the venue, sending only the highlights to the cloud. Also, think about how often sensors capture data: a camera counting people might update every second, whereas a manual scan of a badge is event-driven. Design your monitoring strategy so that high-priority metrics (like entry counts, transaction approvals, sensor alerts) are processed with minimal delay. Many modern systems use event-driven architecture – meaning as soon as a trigger happens (ticket scanned, turnstile rotated, emergency alarm pulled), it pushes an update to the dashboard software via webhooks or sockets, rather than waiting for a periodic refresh. The difference between true real-time and even a 1-minute data delay can be huge when making split-second calls. For example, if a crowd surge is developing, a 60-second data lag could mean hundreds more people pile into a risky area before you act. Thus, aim for sub-minute latency on your critical data feeds. During testing, simulate peak loads and see how the system holds up; it’s better to find a bottleneck in a controlled test than during the actual event.
-
Trained Team and Processes: Technology is only as effective as the people using it. A common mistake is to set up an impressive real-time dashboard but not have a clear plan or trained personnel to interpret and act on the information. Make sure your operations team is comfortable with the analytics tools well before event day. Define who is watching which parts of the data. Large events often assign roles – one person monitors crowd metrics, another watches ticketing and gate flow, another focuses on security alerts, etc., all within the command center. Even for smaller events, it’s wise to designate a “data lead” whose job is to keep an eye on the live dashboard throughout the day (this can be part of someone’s role rather than full-time if the event is modest). Develop SOPs (standard operating procedures) for various data scenarios: e.g., “If any entry line wait time exceeds 15 minutes -> radio the front-of-house manager to open an extra lane” or “If Session X attendance is over capacity -> notify venue staff to allow standing room or divert people to overflow.” Essentially, pre-think the likely situations your real-time data will surface, and decide what actions to take. This prevents paralysis by analysis on event day – the team won’t be scratching their heads about what to do when an alert pops up, because they have a playbook ready.
Training exercises can help tremendously. In the lead-up to an event, run simulations where the team practices responding to simulated data spikes or emergencies. Some forward-thinking organizers hold tabletop drills akin to emergency response exercises: for instance, “Our dashboard shows 20% of scanners just went offline at the west gate – go! How do we handle it?” The more comfortable staff are with the tools and the protocols, the faster and more confidently they’ll react under real pressure. It’s also important to empower the team to act. If every decision from the dashboard requires phoning a distant executive for approval, you lose the timeliness advantage. Instead, give on-site commanders the authority to make necessary calls (like opening gates, spending on extra staff, or pausing the show for safety) in coordination with the data. Many events establish a chain of command where the mission control or operations center has senior decision-makers present so that actions can be authorized in seconds, not hours, allowing teams to coordinate multi-department responses and always pair data with human judgment. When tech and team operate in sync, real-time data truly becomes real-time decision-making.
- Privacy and Data Ethics: Lastly, with great data comes great responsibility. Live tracking of attendees – whether via RFID, mobile apps, or cameras – can raise privacy concerns. Attendees are increasingly aware of data collection, especially in regions with strict laws like GDPR in Europe or CCPA in California. It’s crucial to design your real-time analytics in a privacy-compliant way. This means using aggregated and anonymized data where possible (you don’t need personally identifiable info on a dashboard to manage crowds, just counts and patterns). If you are tracking individual actions (like specific attendees’ session choices in a conference app), ensure you’ve obtained consent and that the data is secured. Many event technology platforms with analytics emphasize data ownership for the organizer while also protecting attendee privacy. For example, Ticket Fairy’s ticketing platform gives organizers full access to their live data – such as ticket scans, marketing performance, and on-site engagement – but that data is processed in compliance with privacy standards, and organisers can choose to anonymize certain views. Build transparency with your audience: some events even turn data around to attendees as a feature. (E.g., a festival app might show them how busy each stage is in real time, as in the Full Circle Festival example where they publicly displayed venue capacities to help fans decide where to go, effectively introducing heat map data for tracking visitor movements in real time.) This not only aids attendees but also demonstrates that data is being used to improve their experience, not to surveil them. In summary, use all this powerful data responsibly. Keep it secure, only share it with those who need access during the event, and communicate to attendees the benefits (shorter lines, safer spaces) that you’re delivering by leveraging real-time insights. Trust is critical – when people trust that you’re using data for their good, they’re more likely to opt in to data-sharing features that make events better for everyone.
| Real-Time Data Source | Metrics Provided | Example Tools & Tech | Key Considerations |
|---|---|---|---|
| Ticket Scanning & Entry | Live attendance count; Entry rate per gate; Wait times | Barcode/QR scanners; RFID turnstiles; Mobile check-in app | Requires strong network or offline sync to central system; Train staff to handle backup if device fails |
| RFID Checkpoints (Zones) | Zone occupancy; Crowd flow between areas; Dwell time in zones | RFID/NFC readers at zone entrances; IoT people counters | Deploy readers at all critical points (stages, entrances, VIP); Ensure integration so all scans feed central dashboard |
| Cashless POS & On-Site Sales | Transaction volume; Revenue by vendor; Inventory levels (if connected) | Cashless payment system (RFID or app); POS terminals (Square, Stripe Terminal) | Reliable connectivity for live sales data; Coordinate with vendors on data sharing; Set alerts for low inventory or high wait times |
| Mobile Event App & Web | Engagement (poll responses, session check-ins, clicks); Session ratings; Social feed sentiment | Event app analytics module; Social listening tools; Live polling platforms | High attendee adoption of app increases data quality; Respect privacy (opt-in for tracking); Monitor social media hashtags for issues |
| CCTV Cameras & Sensors | Crowd density (via video analysis); Queue lengths; Security alerts (e.g., a door left open) | AI video analytics software; Thermal cameras; Smart wristbands for staff tracking | Investment in hardware and AI analytics; Needs expert setup and calibration; Align with privacy regulations for video monitoring |
To successfully implement a real-time event analytics stack, all these pieces must work together. It’s akin to constructing an orchestra of technologies: ticketing systems provide the violins of attendance data, RFID sensors the cellos of crowd flow, POS systems the trumpets of sales, and cameras the percussion of visual crowd cues. The conductor is your central dashboard, and the sheet music is the integration plan that makes sure every section is in sync. With careful planning, the result is a harmonious stream of information that keeps your event team a step ahead of whatever the day may bring.
Implementing Live Analytics at Any Scale
It’s easy to assume that only colossal events with equally large budgets can benefit from real-time analytics, but the reality is that events of all sizes are jumping on this trend – and scaling the approach to fit their needs. Here are how real-time data can be leveraged by a range of event sizes, from a 500-person corporate seminar to a 500,000-attendee festival:
-
Small Events (a few hundred attendees): At a smaller scale, you might not have a high-tech command center or an army of sensors – but you can still reap the rewards of instant insights. Even simple tools make a big difference. For example, a 300-person business seminar can use a basic online dashboard from its registration platform to watch check-ins live. If only 150 people are checked in when the opening remarks are set to begin, organizers might decide to wait 10 extra minutes or send a quick text blast to remind latecomers – a courtesy that ensures more of the audience is present for key content. Small events often have leaner teams, so a single dashboard that shows “who’s in the room” and “who’s still expected” can guide the host’s decisions. Likewise, a modest music gig at a club can use the ticketing system’s live sales feed to decide whether to release a few more door tickets or when to start the headline act (e.g., if lots of ticket holders haven’t arrived yet, maybe delay by 15 minutes). Affordable tools are available: many cloud-based event ticketing software solutions include basic real-time analytics, and there are plug-and-play foot traffic counters or even free Google Analytics for tracking web engagement on a hybrid event’s stream. The key at this scale is not to overwhelm yourself with data – pick 2–3 metrics that matter the most (perhaps check-in count, session feedback, and social sentiment) and focus on those. Even a solo event organizer with a laptop can keep an eye on a live Google Sheet of responses or a ticketing app’s dashboard to stay nimble.
Scaling Insights for Small Events — Even simple check-in dashboards help organizers decide when to start programming based on actual arrivals. -
Mid-Size Events (1,000–10,000 attendees): At this level, events typically span multiple sessions or areas and have a small team or volunteers in different roles. Here, integration and communication become more important. A mid-size fan convention, for example, might employ an event technology platform with analytics that combines ticket scans, a schedule app, and even a basic RFID or beacon system for crowd flow in the expo hall. Organizers should invest in connecting their systems: it could be as straightforward as ensuring the ticket scanning app and the conference app share data so that when someone checks into the venue, their app is activated and the organizer sees total in-venue count. With a few thousand people, consider using real-time metrics to allocate resources like snacks, seating, and staff attention. If your live data shows that Panel Room A is at 20% capacity but Panel Room B is overflowing, you might dynamically swap the next sessions or signal to folks that an encore of the popular panel will happen later (reducing FOMO frustration). Mid-size music festivals (say 5,000 attendees) often start to use RFID for access and payments, which provides a wealth of data. Even if you don’t have a high-end system, you can deploy handheld tally counters or use Wi-Fi device counts as a proxy to know when one zone is getting too full. Many mid-size events partner with tech providers that offer package deals for hardware + software on-site – for instance, renting an RFID access control system that includes a live monitoring dashboard for relatively low cost. The ROI can be felt in things like shorter lines (you see a line building, you act) and happier sponsors (you can tell them live how many visited their activation). One case study revealed that a regional 5,000-person festival in Belgium introduced real-time venue capacity heat maps across its 35 small venues, which helped attendees choose where to go next and reduced crowding at popular spots by tackling crowding challenges and monitoring visitor movements in real time. This was done with QR code wristbands and scanners at each door – technology well within reach of mid-size events.
-
Large Events (10,000+ attendees): At the big leagues, real-time analytics moves from helpful to absolutely critical. Large-scale events should strongly consider a dedicated control center and a comprehensive tech stack as discussed earlier. At 50,000 attendees and above (think major festivals, stadium concerts, large trade expos), the volume of data is huge – but also full of insights. These events often have multiple concurrent activities (stages, halls, etc.) and complex logistics (parking, transport, multiple entry gates, medical and security teams on alert). A unified real-time command center is the nerve center here, which is exactly what a mission control center requires to manage large-scale events effectively. Investing in a platform or custom solution that integrates everything – ticketing, cashless, staff comms, weather, you name it – pays off by enabling the kind of coordinated response that prevents minor issues from snowballing. For example, a top-tier festival might integrate its ticketing platform’s live data with a CRM and messaging system, so that if one area is reaching capacity, it can automatically push a tailored SMS to VIP ticket holders suggesting a lounge area that’s currently open and comfortable. Big events should also employ specialized analytics like predictive modeling – some systems use AI to forecast, say, crowd surges 10 minutes before they happen based on current trajectories, giving staff a valuable head start. Large venues partnering with tech giants (Cisco, IBM, etc.) have showcased dashboards that fuse dozens of data feeds, from beer sales per minute to security incident reports, into one war-room screen. While that level of custom tech is expensive, large events often have the budget and incentive (avoiding a PR disaster or fine) to justify it. However, even at large scale, it’s not only about tech – it’s about team communication. In fact, the bigger the event, the more you must emphasize training and clear protocols as mentioned. It’s common for large events to bring in outside experts or consultants (often experienced folks from previous Olympics, World Cups, etc.) to run their mission control, precisely because those experts know how to interpret live data under pressure and make the right call. As an organizer of a large event, it’s wise to partner with a ticketing or event tech provider that has proven capability at scale. For instance, Ticket Fairy’s festival ticketing platform is built for multi-day events with high volumes, offering real-time dashboards and automatic updates even when handling hundreds of thousands of transactions and scans. The support of a platform that has been battle-tested by other large events can be invaluable when your own big day arrives.
Anticipating Future Crowd Movements — Advanced AI modeling uses current flow patterns to predict and prevent congestion before it actually happens.
Despite differences in scale, the underlying benefit of real-time analytics is universal: better data leads to better decisions, which lead to better outcomes. Smaller events may use a lighter touch and react in simpler ways, while mega-events have elaborate setups and playbooks. But in all cases, having current information is preferable to flying blind or relying on yesterday’s news. Organizers at any scale should start with what they have – even a single laptop with a sales ticker or a tablet showing check-in progress is a step toward more responsive event management. From there, you can layer on additional data sources and integrations as your event grows. The beauty of many modern event tech solutions is their modularity; you can start with just ticketing analytics, then maybe add an RFID system next year, and plug that into the same dashboard, and so on. The important part is the mindset: fostering a culture in your team of looking at the data and asking “What is it telling us right now, and do we need to adjust?” When that habit takes hold, even the smallest event can reap outsized rewards in attendee satisfaction and operational smoothness.
Lessons Learned: Successes and Pitfalls to Avoid
As with any innovation, implementing real-time analytics for events comes with a learning curve. Many organizers have shared stories of both triumphant wins and unexpected challenges when putting live data into practice. Here are some distilled lessons from those who’ve pioneered this approach:
-
Don’t Drown in Data – Prioritize Actionable Insights: One festival producer quipped that the first year they set up a fancy dashboard, it was like “drinking from a firehose of numbers.” They tracked everything from weather to Wi-Fi logins, but the team got lost in the noise. The takeaway is to focus on the metrics that drive decisions. It’s better to have five key metrics everyone watches (and knows how to act on) than fifty stats that look cool but yield no clear action. Start with critical areas: attendance/entry, crowd safety, sales, and any unique KPI for your event type. You can always expand later. In practice, this might mean if you’re running a conference, prioritize live attendance and feedback scores, and ignore less relevant data like, say, real-time electricity consumption unless it becomes critical. Use your event goals to define what “actionable” data is. If a data point won’t change anyone’s behavior during the event, it probably doesn’t need to be front and center on your live dashboard.
-
Validate Data Accuracy: Real-time decisions are only as good as the data feeding them. A hard lesson some have learned is that tech can misfire – scanners can double count or miss scans, sensors can glitch. Early in adoption, a stadium ops team recounts how a faulty people counter reported an exit gate as clear when in fact a small group was still outside waiting; they nearly locked the gates prematurely. Now their motto is “trust but verify.” Build in cross-checks for your data. For example, if your RFID system says 10,000 people are in the venue but your ticket scans say 9,500, investigate the discrepancy (perhaps some exits didn’t scan out, etc.). Calibrate your systems before the event (walk test the crowd counters, run test transactions through POS). Also ensure time sync across devices – something as simple as one scanner being out-of-sync by 5 minutes can confuse matters. Many platforms provide data confidence indicators or allow you to set thresholds to ignore outlier readings. Use those features. And always have a backup method to get a “sanity check” on crucial numbers. For instance, if your digital count of attendees is pivotal for safety, consider having security do a quick manual count sample or use aerial photography at peak to validate density.
Ensuring High Data Integrity — Cross-referencing digital scans with manual checks ensures that critical safety decisions are based on accurate numbers. -
Make Data Human-Friendly: Your ops team might not all be data scientists – nor should they have to be. Design your real-time reporting so it’s easily readable under stressful conditions. Use visual cues (color codes, big fonts for key numbers, simple graphs). During a live event, nobody has time to interpret a complex spreadsheet. It can help to involve end-users (the staff who will be in the command center or on the radios) in the design of the dashboard during pre-production. Find out what information they feel would help them, and in what format. Sometimes a simple traffic light system (green = all good, yellow = watch, red = act now) can convey status faster than raw numbers. The lesson from seasoned pros is that the tech should inform decisions at a glance. If your team is pausing to decipher what the data means, you likely need to simplify the interface or provide better legend/context. Also, consider the mobility of data – a central screen is great, but field managers might benefit from alerts on their mobile devices, like a vibration or ping for critical alerts (queue length, capacity hit, etc.). This ensures the insight actually reaches the person who can act, in real time.
-
Beware of Decision Paralysis and Overreactions: Interestingly, having a flood of real-time data can sometimes lead to knee-jerk reactions that aren’t optimal. For example, an organizer might see a momentary dip in sales at one bar and rush to reallocate staff, only to find it was a short-term lull and now the original bar is understaffed. The wisdom here is to combine data with context and judgment. Not every blip warrants intervention – sometimes trends stabilize on their own. A seasoned event technologist suggests using rolling averages or short time windows (e.g., look at a 5-minute trend, not every second) to smooth out noise. And always cross-check if possible: if one metric looks bad (say, social media mentions of “crowd”), confirm with your on-ground team or another data point before sounding the alarm. Essentially, real-time doesn’t mean instant panic – it means quicker awareness. Decide in advance what triggers will merit actions and what thresholds are meaningful. This prevents the team from chasing every up and down like a day-trader watching stock ticks. Discipline in interpreting the data develops over time; doing post-event reviews of how real-time decisions panned out can help refine your approach (e.g., “We moved people too soon on Saturday, next time let’s wait 2 more minutes to see if it resolves before redirecting”).
-
Integrate Real-Time Data into Post-Event Analysis: Don’t treat live analytics and post-event reporting as separate universes. They inform each other. The immediate adjustments you make should be studied afterwards to gauge effectiveness. If you redirected crowds from Stage X to Y at 4pm, analyze whether those attendees indeed went to Y (did Y’s numbers jump?) and whether X stabilized. This will teach you if your interventions are working as intended. It also provides great storytelling for stakeholders – you can show sponsors or executives tangible examples: “Look, when we added two staff to the gate at 3pm, throughput increased by 20% within 10 minutes.” Those kind of instant ROI demonstrations can justify the investment in these tools. Moreover, the data you collect in real time becomes part of your event’s data trove for planning future events, as RFID analytics tie back to post-event reporting while respecting GDPR and relevant privacy laws. Save it, back it up, and analyze it alongside surveys, financials, and other traditional metrics. Many event organizers hold debrief meetings where they replay the event through the lens of the real-time data: charts showing entry peaks, heat maps of movement, graphs of sales over time, which can reveal engagement levels and optimize future planning. These insights often spark ideas to improve next time (e.g., if data showed a huge surge at the coat check at 5pm, maybe plan entertainment or staggered programming to spread that out). In essence, real-time analytics not only elevates the current event, it enhances your playbook for all future events – if you take the time to learn from it.
Closing the Live Feedback Loop — Immediate attendee ratings allow organizers to pivot content or fix environmental issues while the event is still running. -
Choose the Right Partners: Finally, know when to leverage outside expertise. Not every organization has the in-house resources to develop complex analytics systems – and that’s okay because the ecosystem of event tech vendors has evolved significantly. Work with platforms and providers that have a track record for real-time support. When evaluating options, ask pointed questions: Does the ticketing system offer a live dashboard or just end-of-day reports? Can the RFID vendor’s data integrate with your app in seconds? Can the tools send real-time event data analysis reports to multiple devices or users simultaneously? It’s wise to do trial runs or reference checks. Speak to other event organizers (in your network or through forums) about which systems they found reliable under pressure. Many of the fan-first event platforms in 2026 emphasize real-time analytics and data ownership as core features like providing a comprehensive game day dashboard, which is a shift from older ticketing services that often kept organizers in the dark until after the show. If you feel locked out of your own live data with your current provider, that’s a red flag – it might be time to explore more transparent solutions. Look for a platform that treats data as a collaborative asset with the organizer. For instance, Ticket Fairy’s platform streams live sales and check-in data to organizers and even provides API access for custom integrations, reflecting the philosophy that it’s your data happening at your event, so you should have it in your hands immediately. The ultimate partner is one that not only provides the tech but also supports you with guidance on how to use it (some companies have event success managers or on-site support for big events to help interpret that live dashboard with you). Those extra sets of experienced eyes can be reassuring in the frenetic environment of a major live event.
In conclusion, real-time event analytics is transforming live events from reactive to responsive environments. The path to success involves the right tech tools, thoughtful implementation, and a team ready to translate numbers into action. By learning from the pioneers who have already navigated this journey – celebrating their wins and noting their missteps – you can more smoothly integrate instant data into your own events. The outcome is well worth it: events that run safer, smoother, and more profitably, delighting attendees and impressing stakeholders in the process.
Frequently Asked Questions
What is real-time event analytics?
Real-time event analytics involves using live dashboards and instant data feeds to monitor event metrics like attendance, sales, and crowd density as they happen. This technology allows organizers to make immediate, data-driven decisions during an event rather than relying on post-event reports, ultimately improving safety and attendee experience.
How does real-time data improve the attendee experience at live events?
Instant data improves the attendee experience by allowing organizers to proactively resolve issues like long queues and overcrowded areas. Industry analysis shows that events leveraging real-time monitoring can cut average wait times by 30 to 50 percent and significantly increase attendee satisfaction and per-head spending.
How do event organizers monitor crowd density in real time?
Organizers monitor live crowd density by aggregating data from RFID wristband scans, IoT sensors, and AI-powered overhead cameras. These connected systems feed into a centralized dashboard to create dynamic heat maps, enabling staff to identify packed zones and proactively redirect foot traffic away from dangerous bottlenecks.
What technology is required to build a real-time event analytics stack?
A robust real-time analytics stack requires API-first connected data sources, a unified event operating dashboard, and resilient network infrastructure. Organizers must integrate ticketing, RFID access, and cashless point-of-sale systems using high-speed 5G or robust Wi-Fi with offline caching to ensure sub-minute data latency during the event.
How can live analytics increase on-site event revenue?
Live analytics increases revenue by tracking cashless point-of-sale transactions and inventory levels in real time. If data shows a specific bar or merchandise booth is experiencing high demand, organizers can immediately deploy extra staff, restock popular items, or send promotional push notifications to maximize sales opportunities.
Why is real-time crowd monitoring critical for event safety?
Real-time crowd monitoring is essential for preventing dangerous overcrowding and ensuring rapid emergency responses. By utilizing live heat maps and zone capacity alerts, mission control centers can detect crowd surges instantly, allowing security teams to safely redirect attendees or execute targeted evacuations before a crisis occurs.
Can small events use real-time analytics technology?
Small events can easily leverage real-time analytics by utilizing basic cloud-based ticketing software and mobile check-in apps. Organizers of modest seminars or club gigs can monitor live attendance dashboards to adjust session start times, manage door ticket releases, and track attendee engagement without requiring expensive hardware.
What happens to live event data if the internet goes down?
If internet connectivity drops, modern event technology relies on edge caching and offline modes built into ticket scanners and payment terminals. These devices temporarily store scan and transaction data locally, automatically syncing with the central analytics dashboard the moment network connections are restored to preserve accurate headcounts.
How do professional conferences use live data to manage sessions?
Conferences use live badge scans and mobile app check-ins to monitor breakout session attendance as rooms fill up. If real-time data indicates a popular keynote is reaching maximum capacity, organizers can instantly open divider walls or activate pre-planned video overflow spaces to accommodate all interested attendees.
What are the most common mistakes when implementing live event analytics?
The most common mistakes include tracking too many irrelevant metrics, failing to validate data accuracy, and making knee-jerk reactions to minor fluctuations. Organizers should focus on actionable insights, establish standard operating procedures for specific data triggers, and ensure dashboards are visually simple for staff to interpret quickly.