
Чтение отчётов мероприятия
See who buys your tickets in your event demographics
Every section of your event's Demographics screen: who bought, how old they were on the day, what they do for a living, and what each figure is counting.
- Для кого
- Anyone planning who to sell the next event to
- Займёт
- 6 минут
Ваш экран «Demographics»
Что нужно перед началом
- You're an owner or an admin on this event, or you have a Stats or Limited Stats login for it. All four see the same sections.
- Your event has sold tickets. Ages come straight from the orders, and the other two sections fill in about a day after your first sales.
-
Gender Breakdown
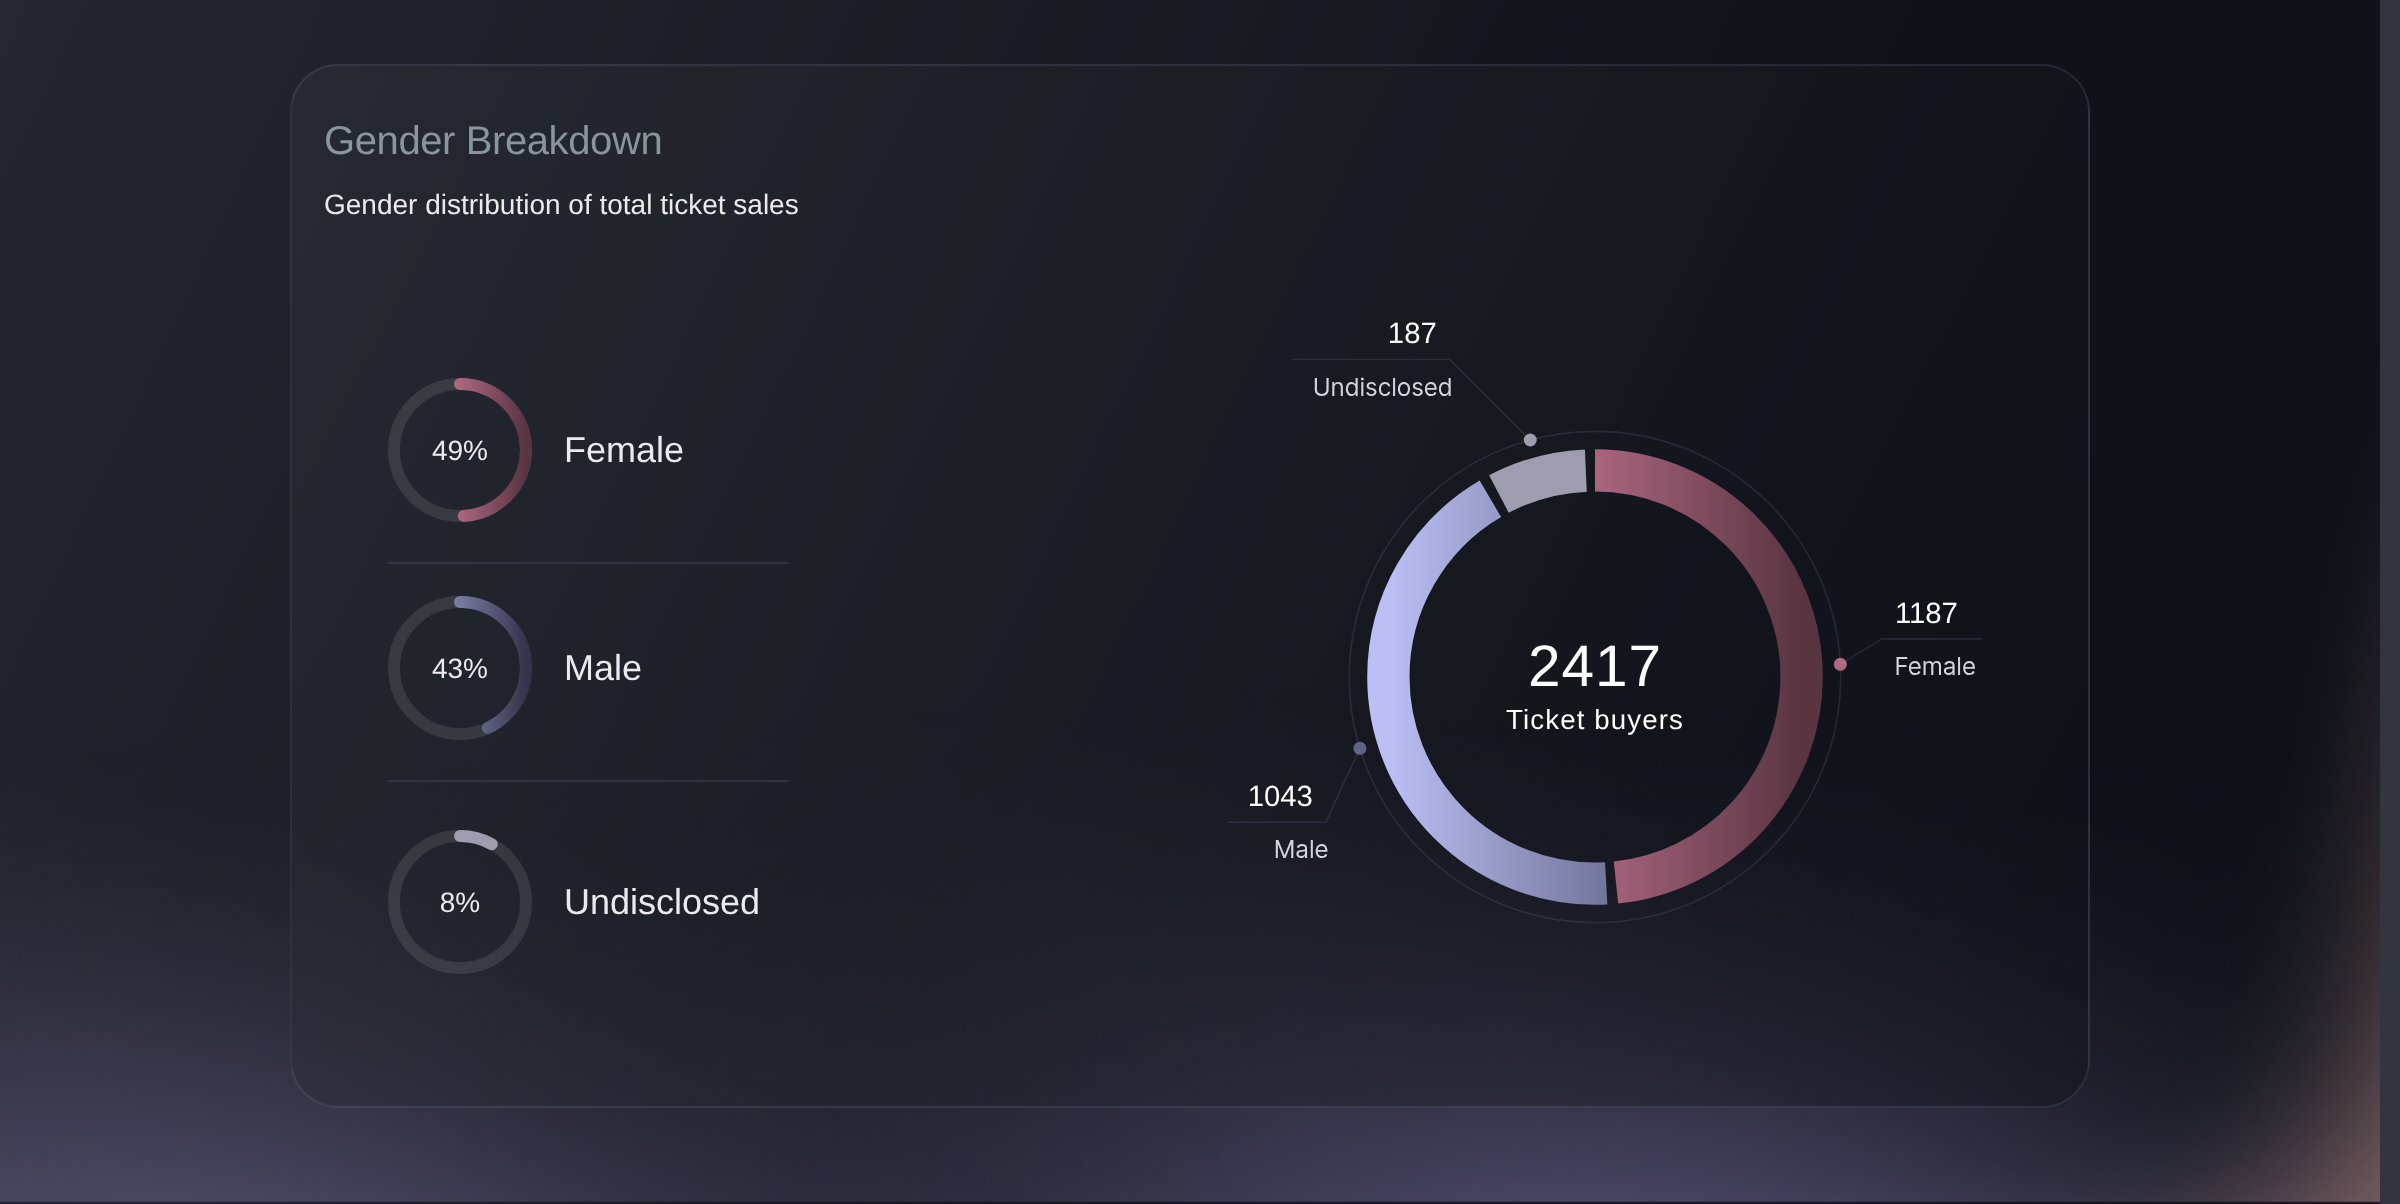
Open your event and go to Demographics. The ring counts ticket buyers, split into Female, Male and Undisclosed, with the same three as a percentage down the left.
Undisclosed is buyers who did not say rather than a gap in your data, so read the other two as shares of who answered. Events that collect gender at checkout instead show only Female and Male. Either way the ring counts ticket lines, so one person buying two ticket types counts twice.
Demographics, Gender Breakdown. -
Age Breakdown
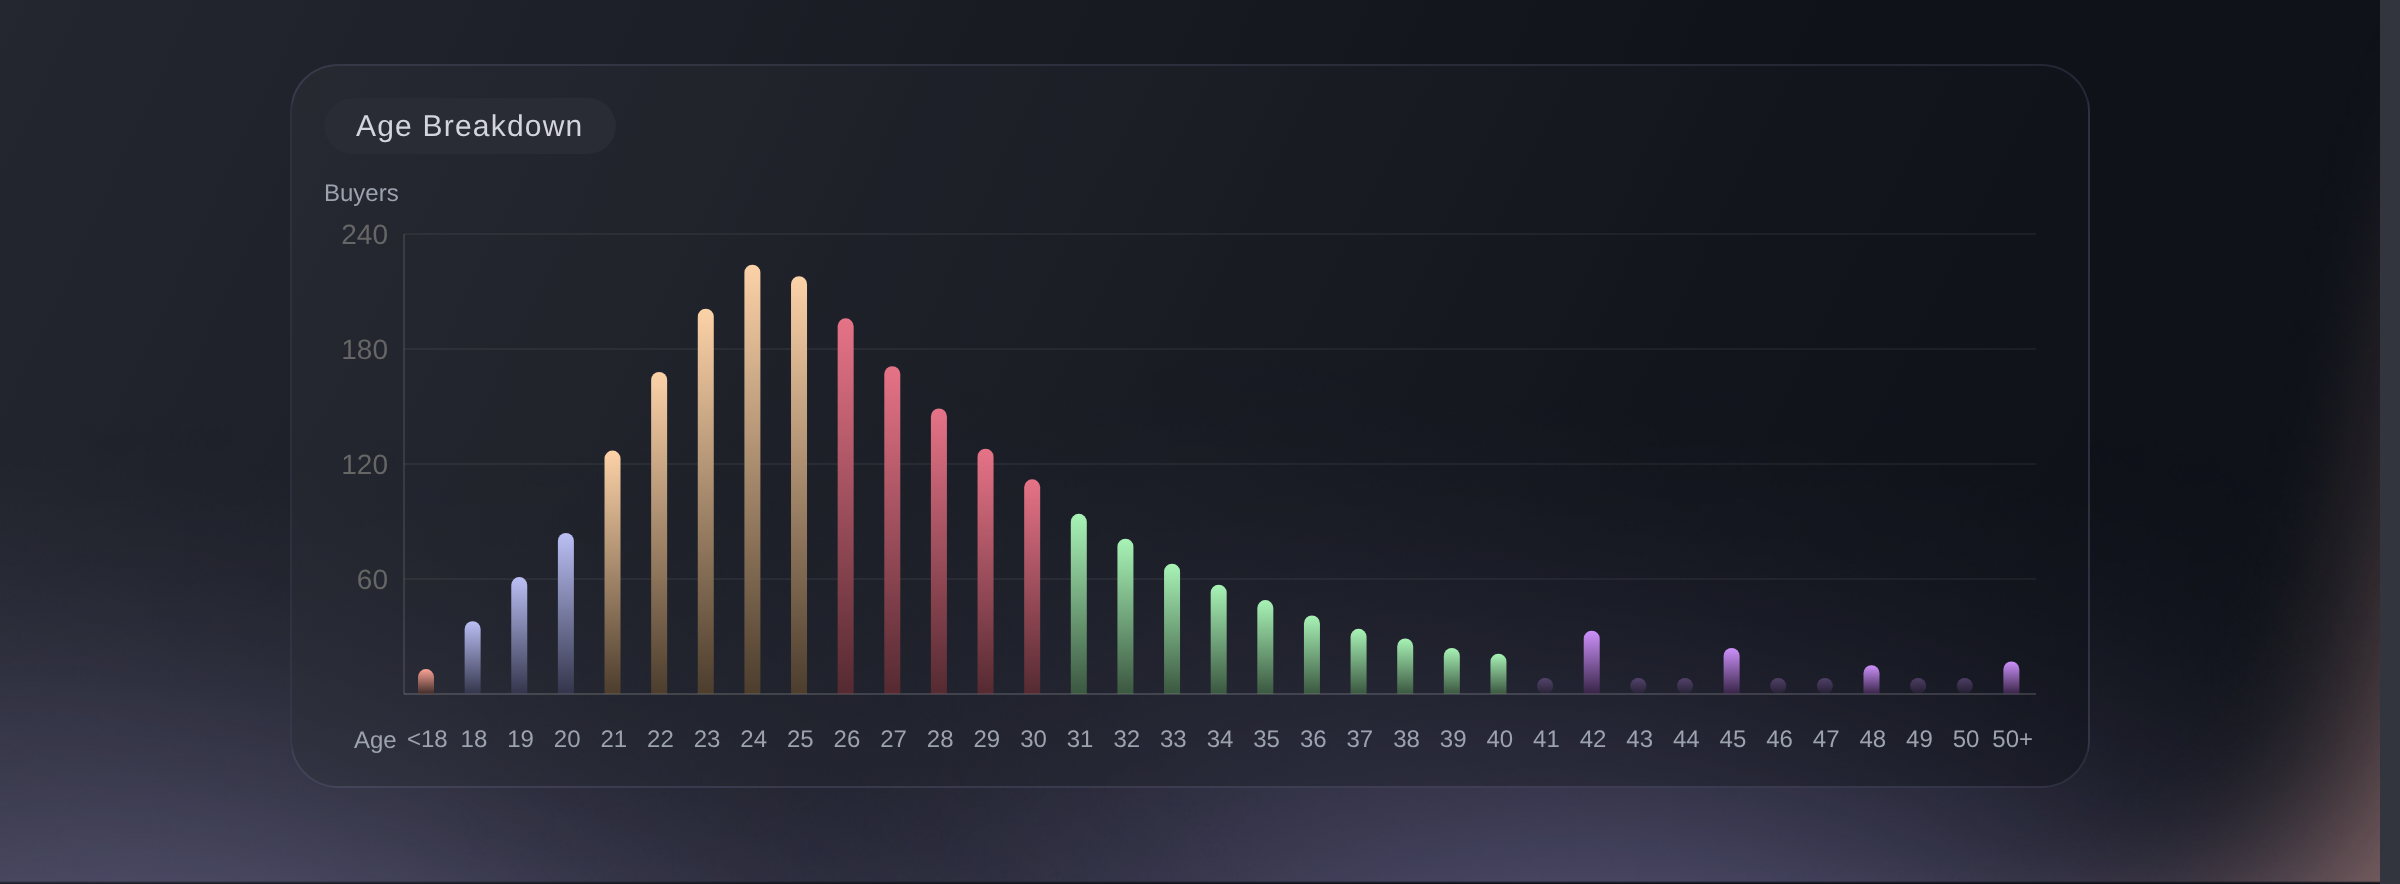
One column per year of age, from your youngest buyer to your oldest. The height is how many bought at that exact age, and resting on a column names both.
A band of ranges hides what this section shows. Two peaks a decade apart are two audiences buying the same event, and each is worth its own ad set rather than one aimed between them. Both age sections count ticket lines, so one person buying two ticket types counts twice.
Demographics, Age Breakdown. -
Age Ranges
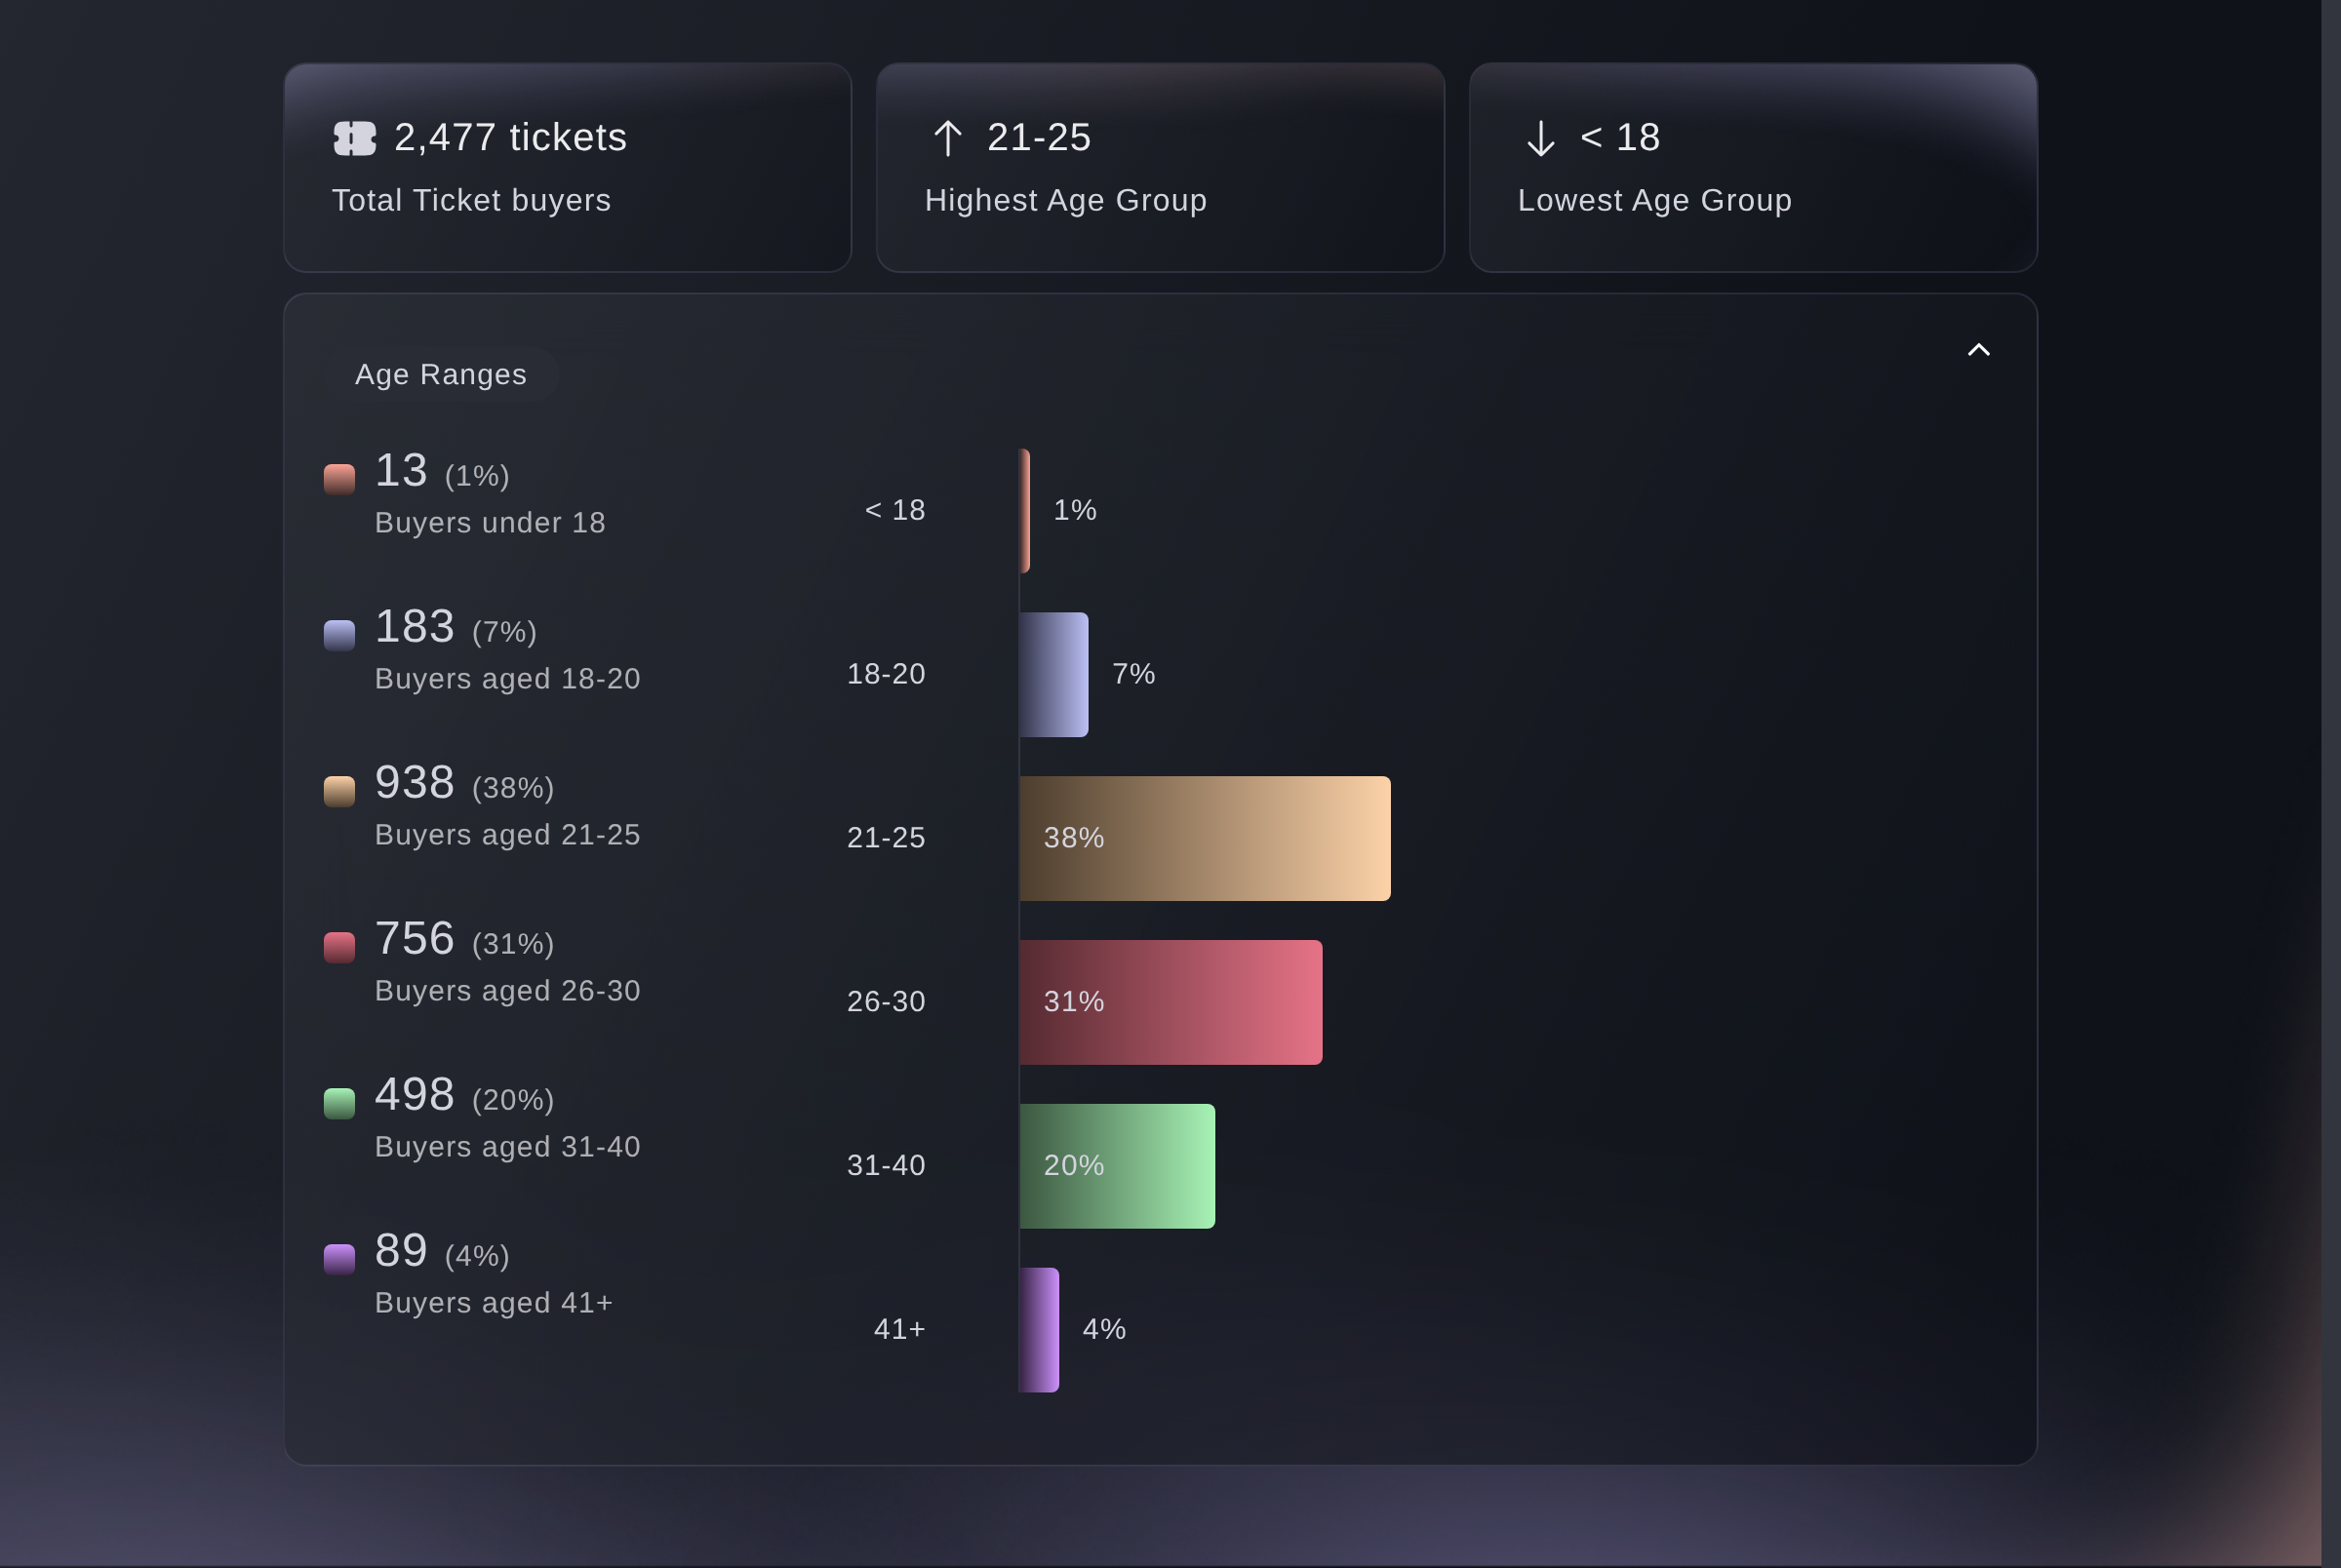
The same buyers in six bands, as a count and a share each. Above them, Total Ticket buyers, the Highest Age Group and the Lowest Age Group.
The total here counts buyers who gave a date of birth, so it sits below your ticket sales rather than matching them. Compare the bands with each other rather than against the number of tickets you sold.
Demographics, Age Ranges. -
Professions
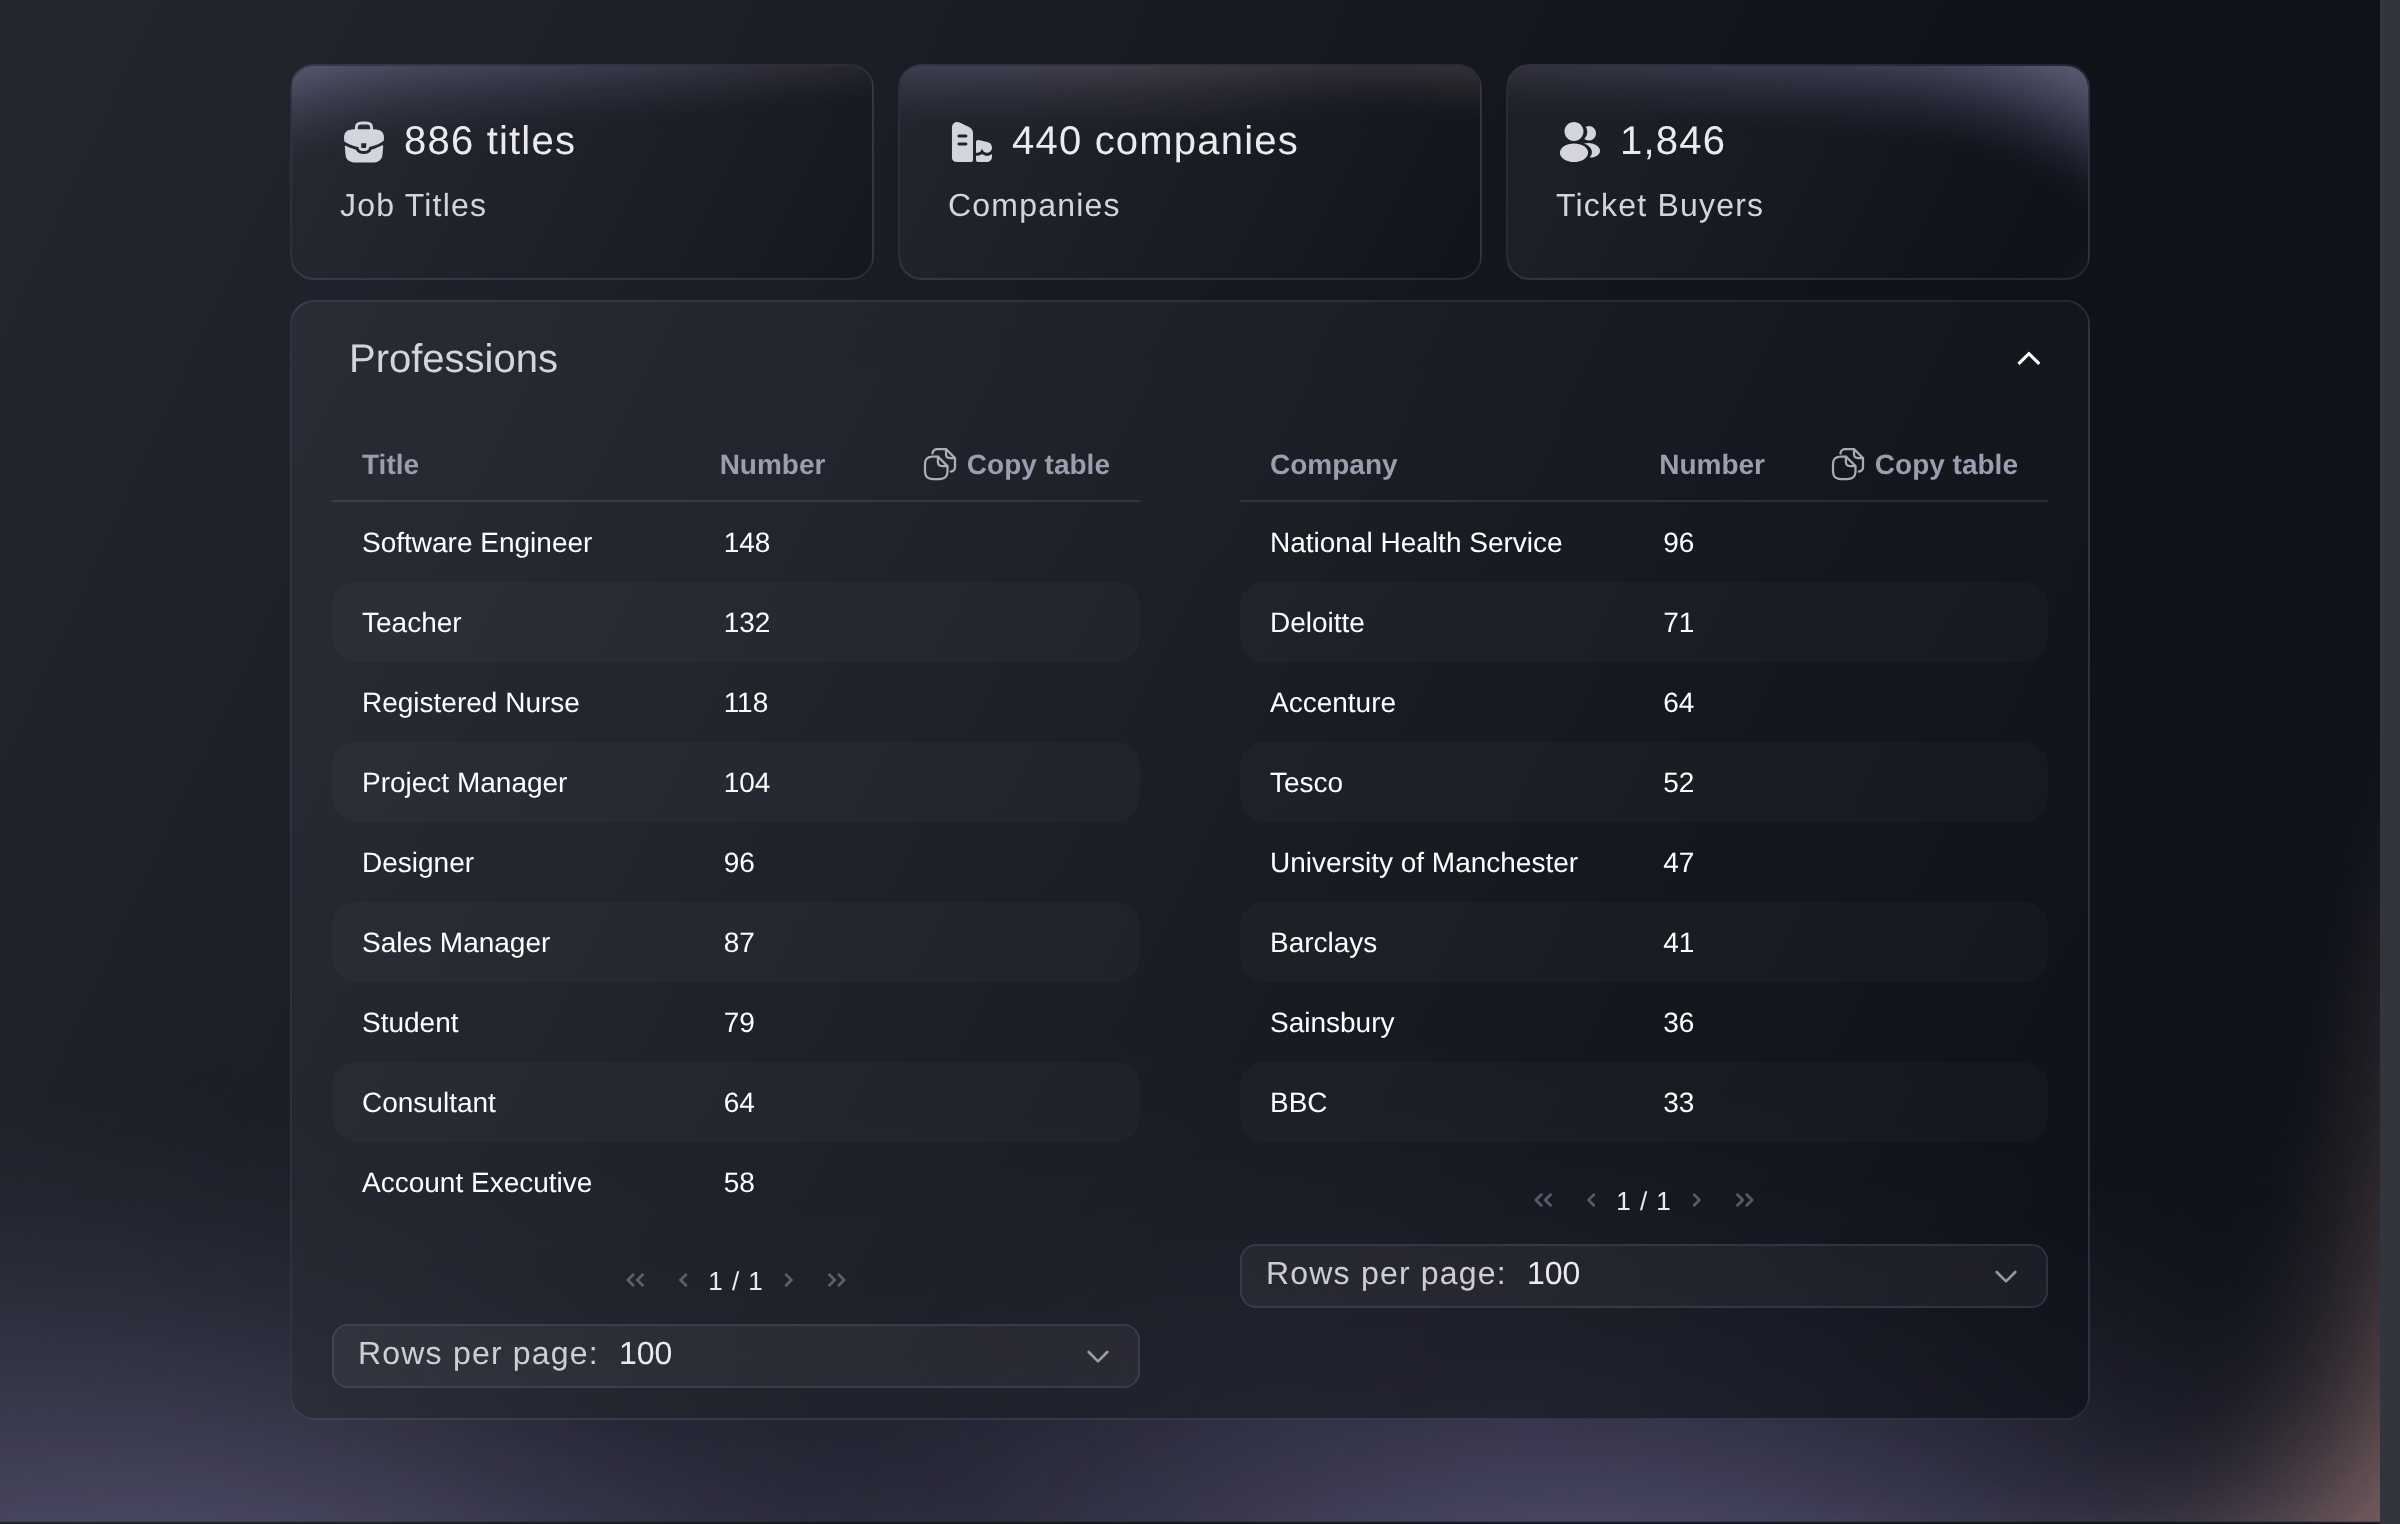
Two tables: job titles on the left, employers on the right, each with how many of your buyers gave it. Copy table puts either one on your clipboard for a spreadsheet.
The three figures above the tables add up the counts in them, so Job Titles is buyers with a title on file rather than how many different titles there are. The table folds the same job written two ways into one row.
Demographics, Professions.


Или поручите это помощнику
Fai, the assistant inside your dashboard, reads the ages on this screen, and so does your own AI assistant through our MCP server. Neither reads the gender ring yet, so ask for the age sections and read that one on the screen.
В вашей панели, с Fai
Look at the ages of the people who bought for this event. Which band bought the most, and how does that compare with the last event I ran?
Из вашего собственного ассистента, через MCP
Подключите ассистента к нашему серверу MCP и попросите его:
Для этого достаточно настройки только для чтения с той страницы. Здесь ничего не меняется, поэтому оставьте --read-only как есть.
Find my event by name, then pull its age demographics and tell me the age band that bought the most and how many buyers gave a date of birth at all.
Из терминала
Установите CLI по ссылке нашей страницы CLI, войдите командой ticketfairy auth login и выберите бренд, с которым работаете, командой ticketfairy brand use <BRAND_ID>. ticketfairy brand list и ticketfairy event list выводят идентификаторы, которые нужны командам ниже.
You need an owner, admin, Stats or Limited Stats login. The CLI reads the same ages as this screen. It doesn't read the gender ring or the professions tables, so read those two on the screen.
The age bands, as they are on the screen
ticketfairy event stats <EVENT_ID> --metric demographics
The same figures, ready for a script
ticketfairy event stats <EVENT_ID> --metric demographics --output json
Вопросы, которые могут возникнуть
- Why is this screen empty when I have sold tickets?
- Professions, and Gender unless your event collects it at checkout, come from an audience report built after your first sales, so a brand-new on-sale answers
This report is not available yet. Please try again in 24 hours
. Ages come straight from the orders, as soon as a buyer has given a date of birth. - How is my buyers' age worked out?
- From the date of birth on their account against the day they ordered, so each buyer counts at the age they were when they bought. Both age sections leave out the buyers who never gave one.
- Why don't the totals on this screen match each other?
- They count different people. The age sections count buyers with a date of birth, and Gender and Professions count the buyers your audience report matched, so the three rarely land on the same number.
- Does this screen include free tickets and guest list?
- Yes. Both age sections read paid orders whatever they cost, so a comp with a date of birth on the account counts like any other. A payment plan still running does not, and joins once its last instalment clears.
- Can I get this out into a spreadsheet?
- Copy table on either Professions table puts it on your clipboard, ready to paste. The charts above have no export of their own: ask Fai for the age figures, and read the gender ring off the screen.
Что дальше
Сделайте это на своём мероприятии
Создайте аккаунт, соберите мероприятие и повторите эти шаги в своей панели. Без предварительного звонка отдела продаж.